z/VM Shared File System Usage
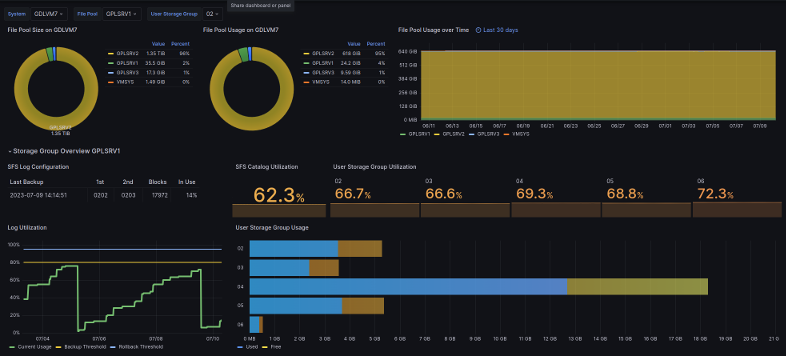
The dashboard is useful for installations that use z/VM® Shared File System to store application or system data and need to monitor space usage. Installations that only use SFS for the standard IBM processes may not find much value in the dashboard.
This dashboard is licensed by IBM under the Apache 2.0 License and is provided ‘as is’ without warranty, representation, support, maintenance or an obligation to issue updates.
Configuration
As the SFS usage data is not in the monitor data, you need to add an additional section to the Data Pump configuration file to enable the data collection. The filepool parameter specifies the file pools to monitor. Refer to the Performance Toolkit documentation for advanced parameters.
[sfs]
  type = sfs
  filepool = gplsrv1 gplsrv2 gplsrv3
The SFS section generates measurements sfsgrp, sfsuse, and sfslog. When you want to retain this data longer than the detailed performance data, create an additional InfluxDB database and divert the SFS measurements to that database (named "zvm_long" in this example).
[long]
   type = InfluxDB
   url = ....
   db = zvm_long
   include = sfsgrp sfsuse sfslog
Define a Grafana data source to point to that InfluxDB database, and remember to select that data source when importing the dashboard. ~
Data source config
Collector config:
Upload an updated version of an exported dashboard.json file from Grafana
| Revision | Description | Created | |
|---|---|---|---|
| Download |