F5 BIG-IP Dashboard
Main BIGIP Dashboard
F5 grafana / prometheus monitor:
Show the following:
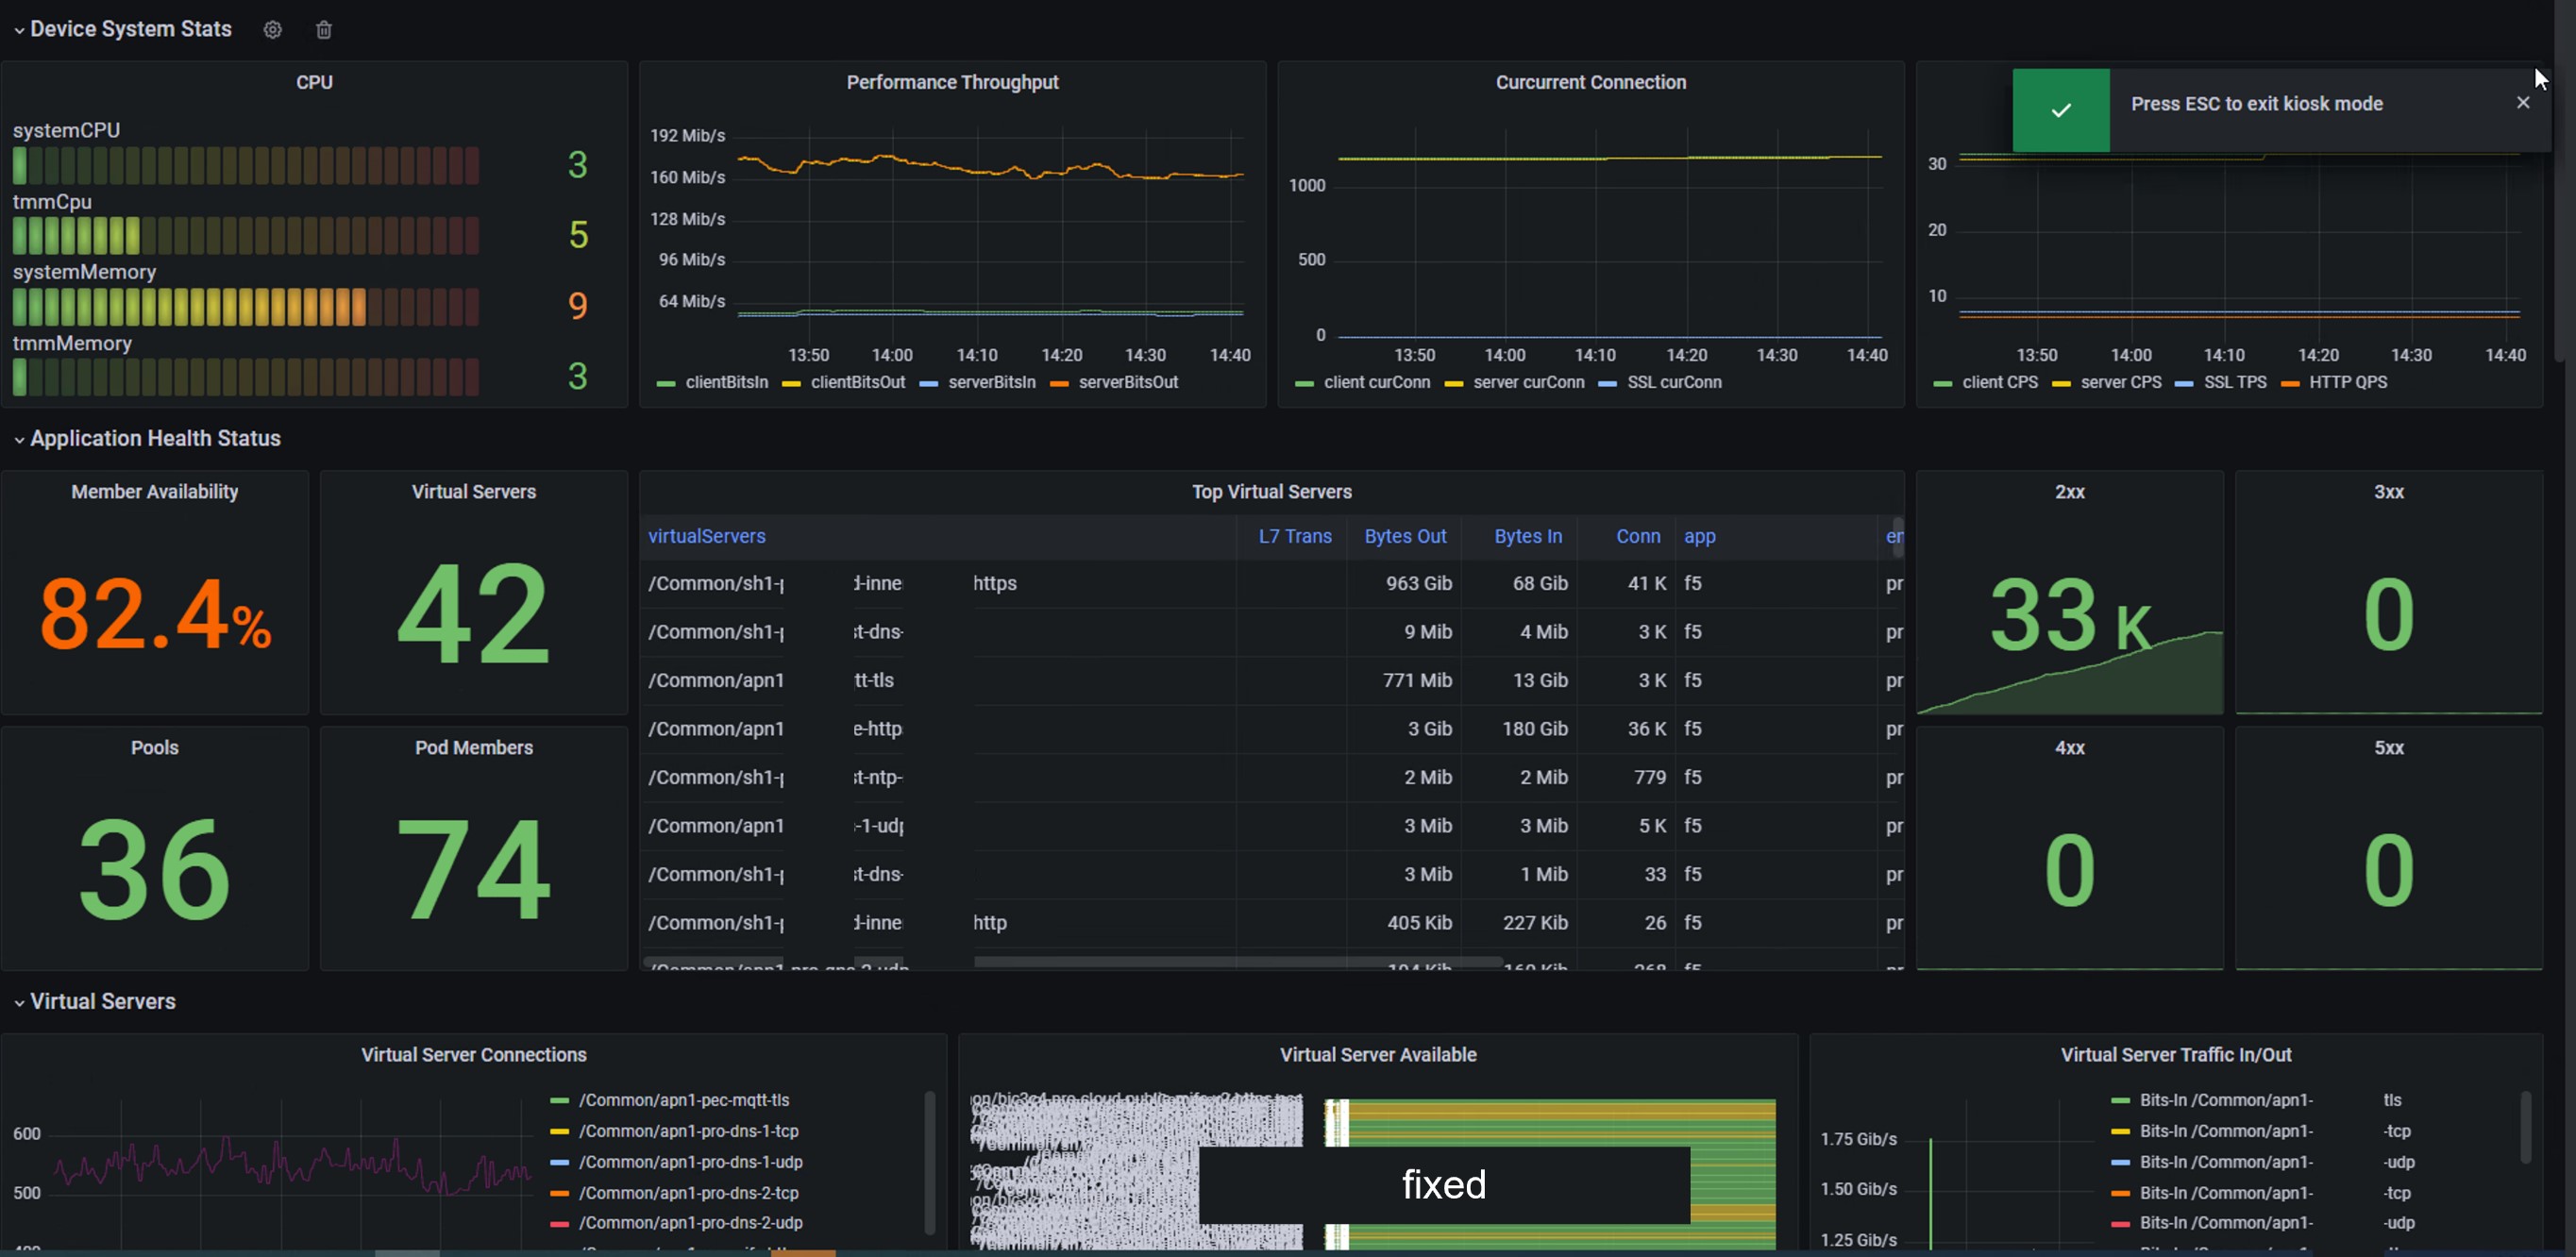
- Overall system performance, including CPU, content, throughput, concurrency, SSL performance, HTTP performance, etc.
- The overall state of the business system, including VS state
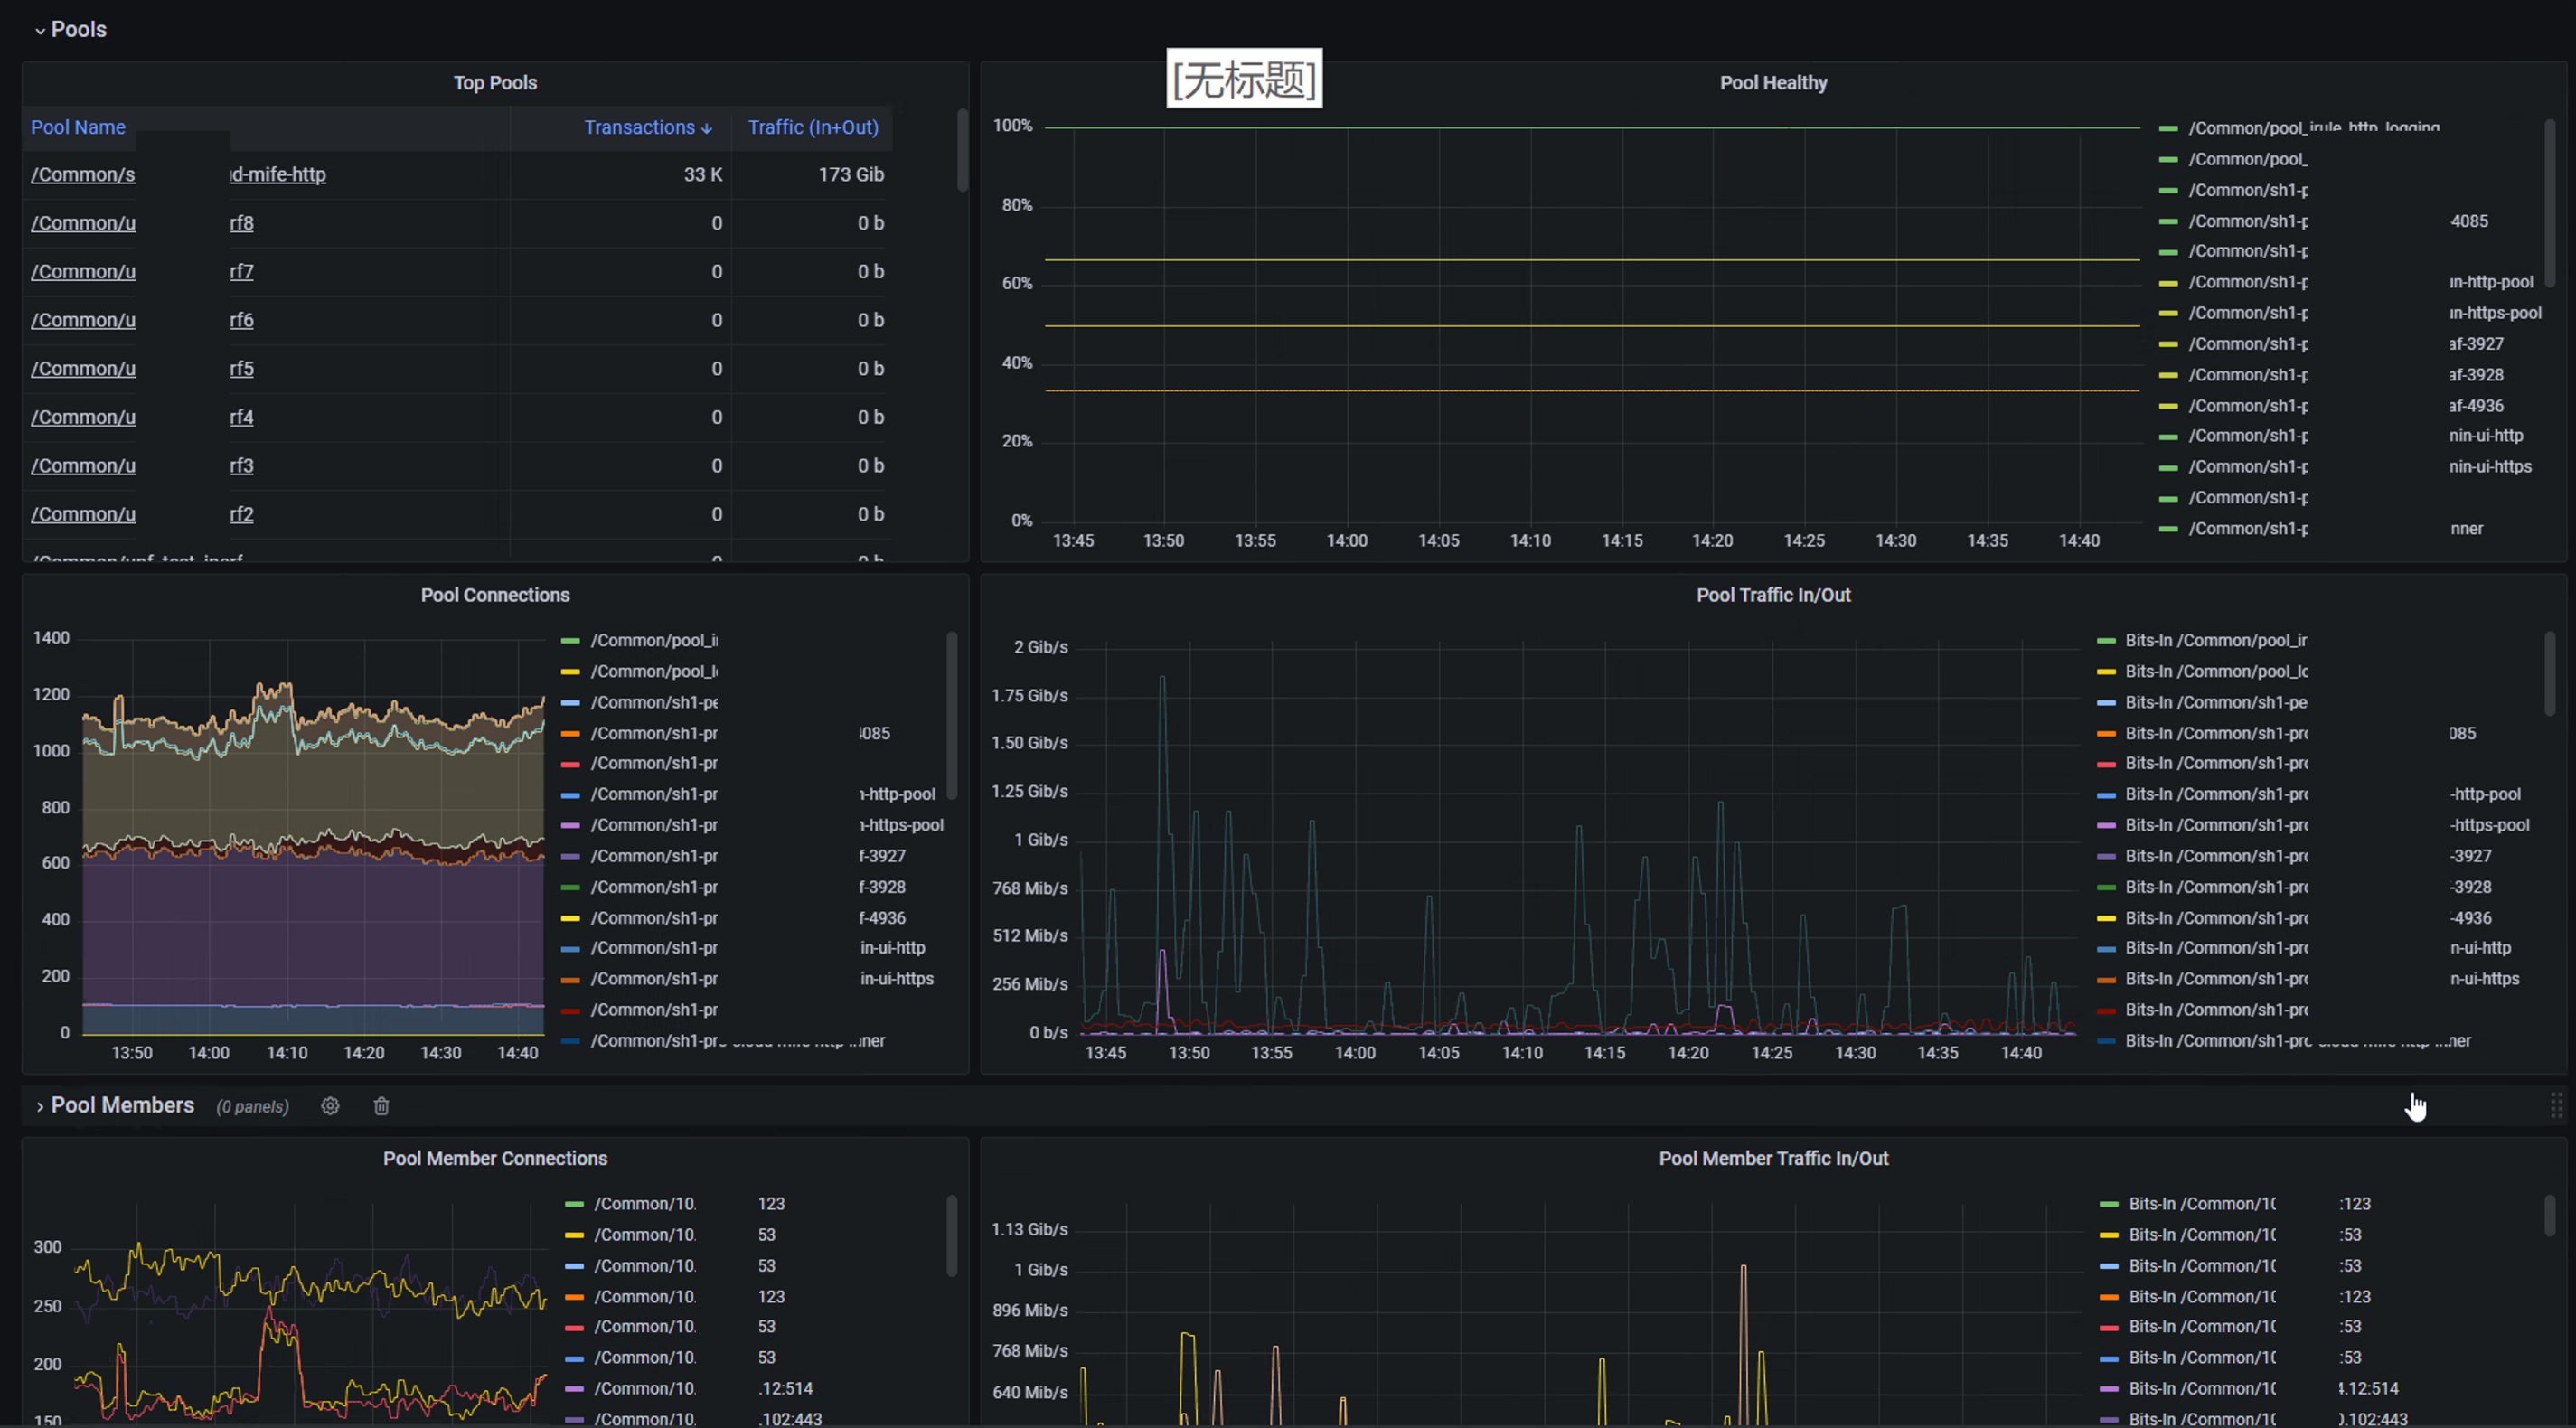
- Status of the backend resource pool
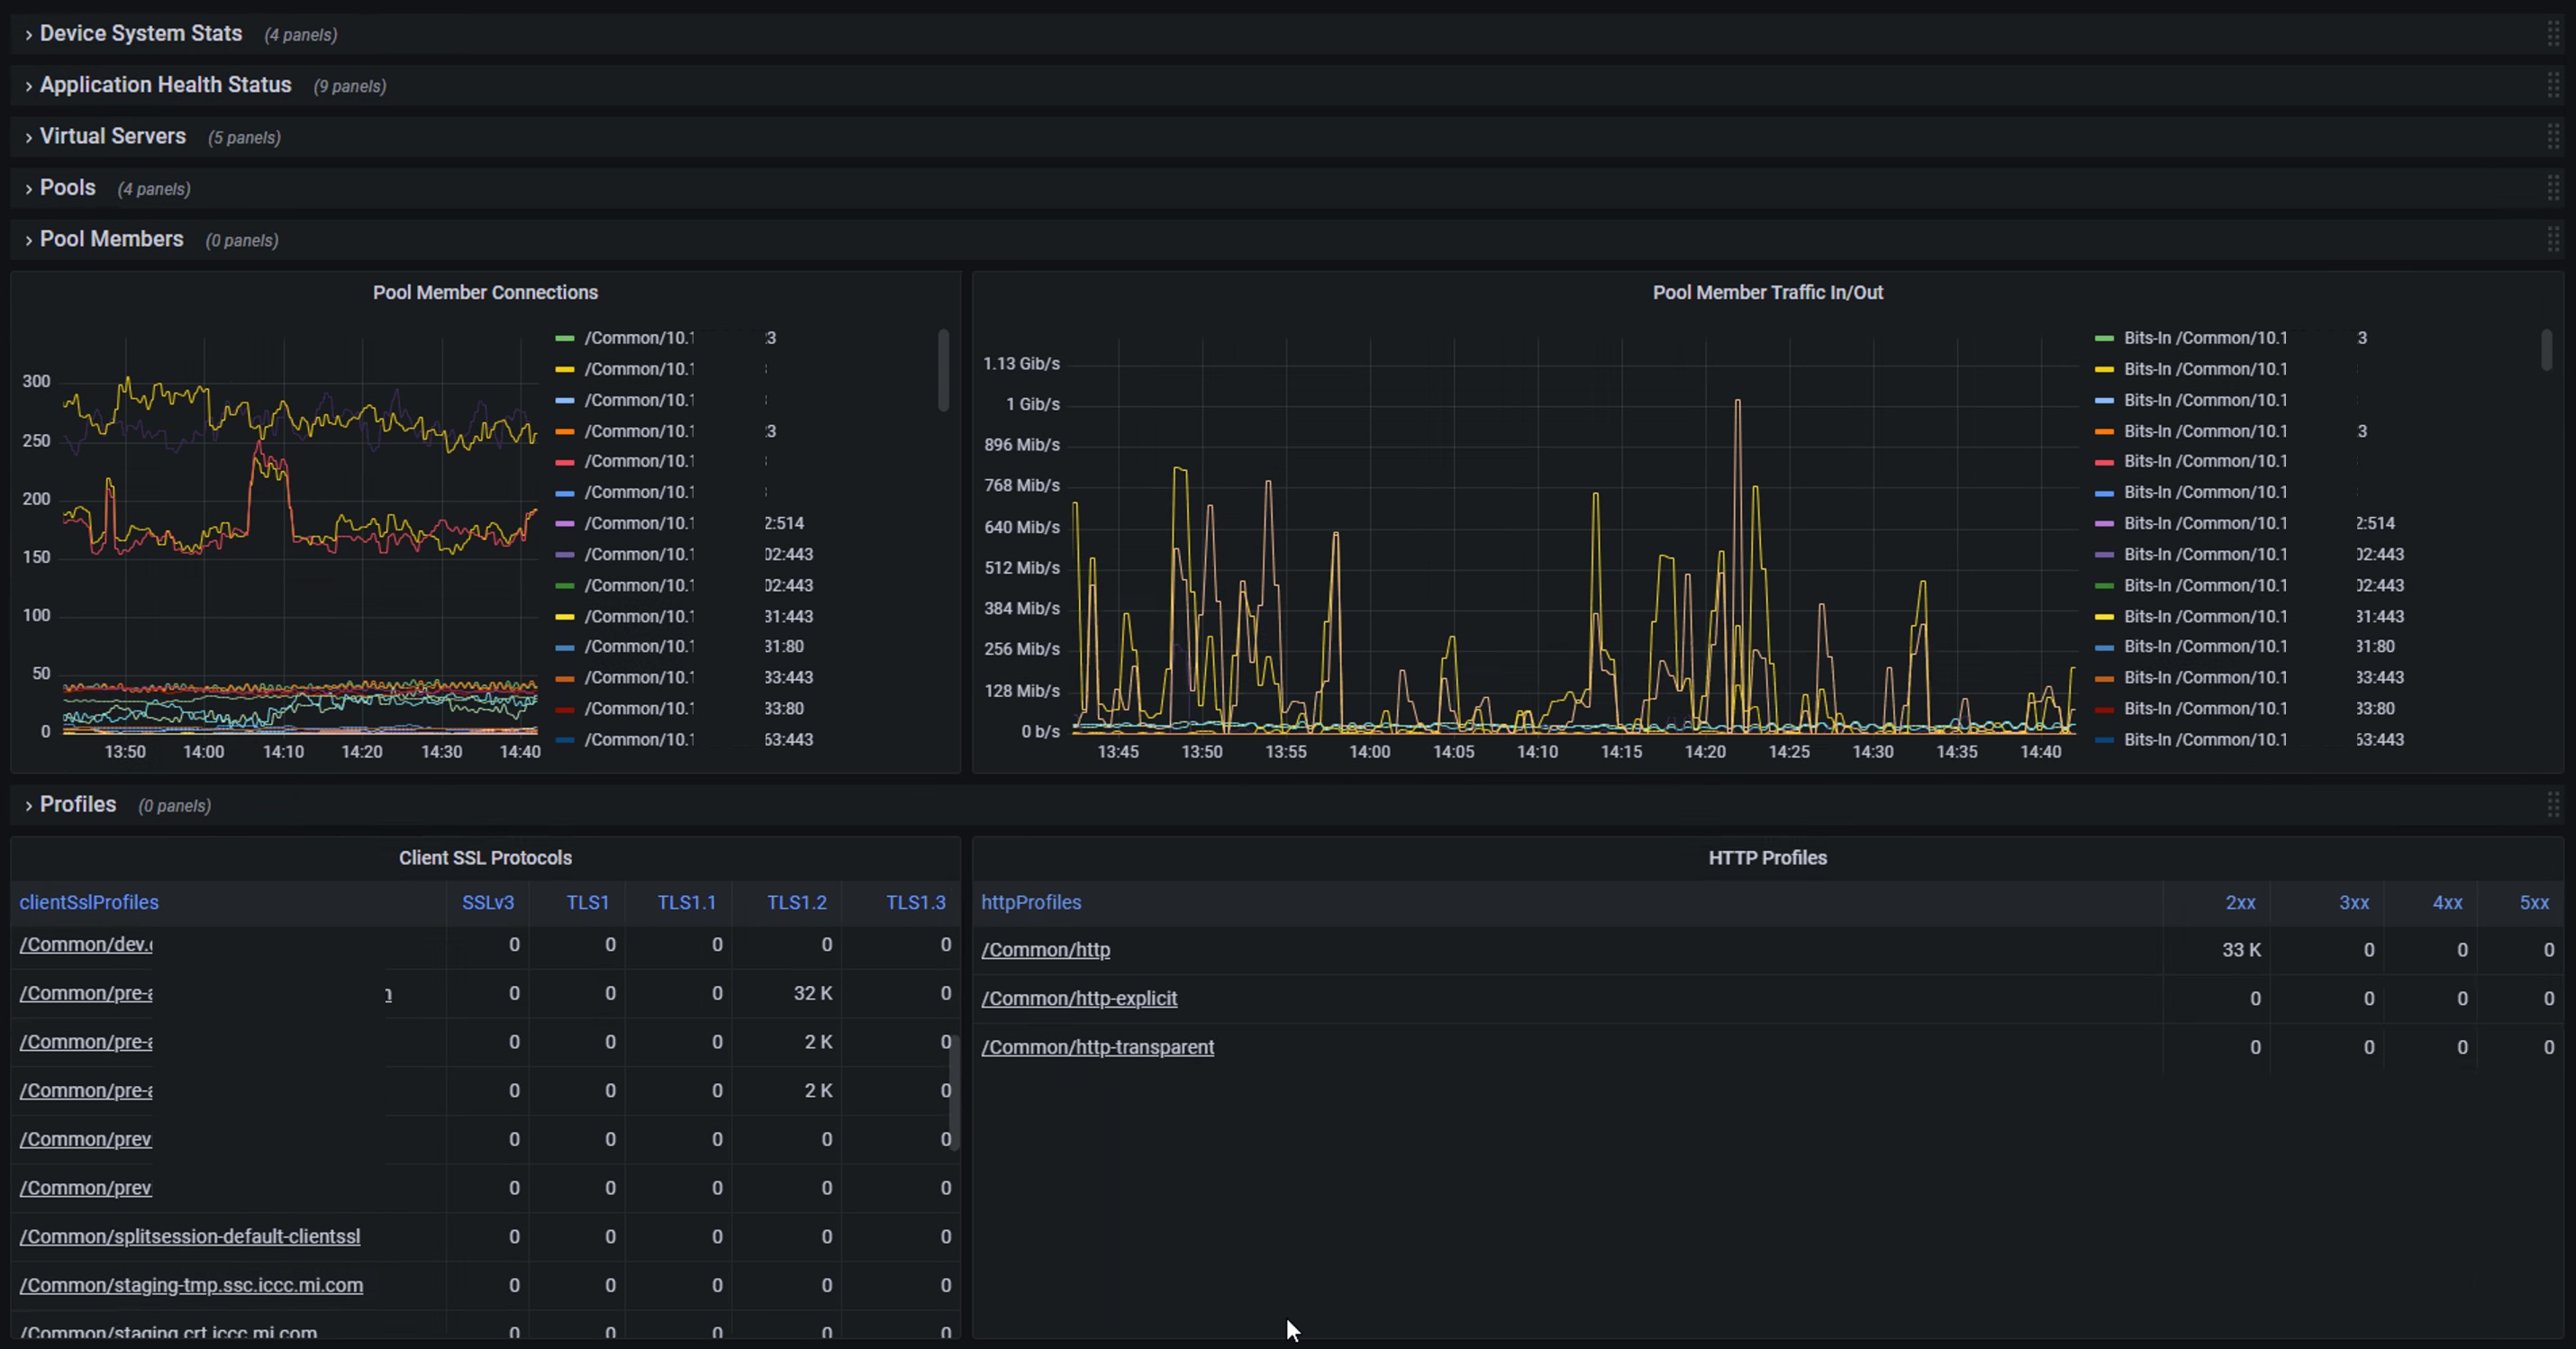
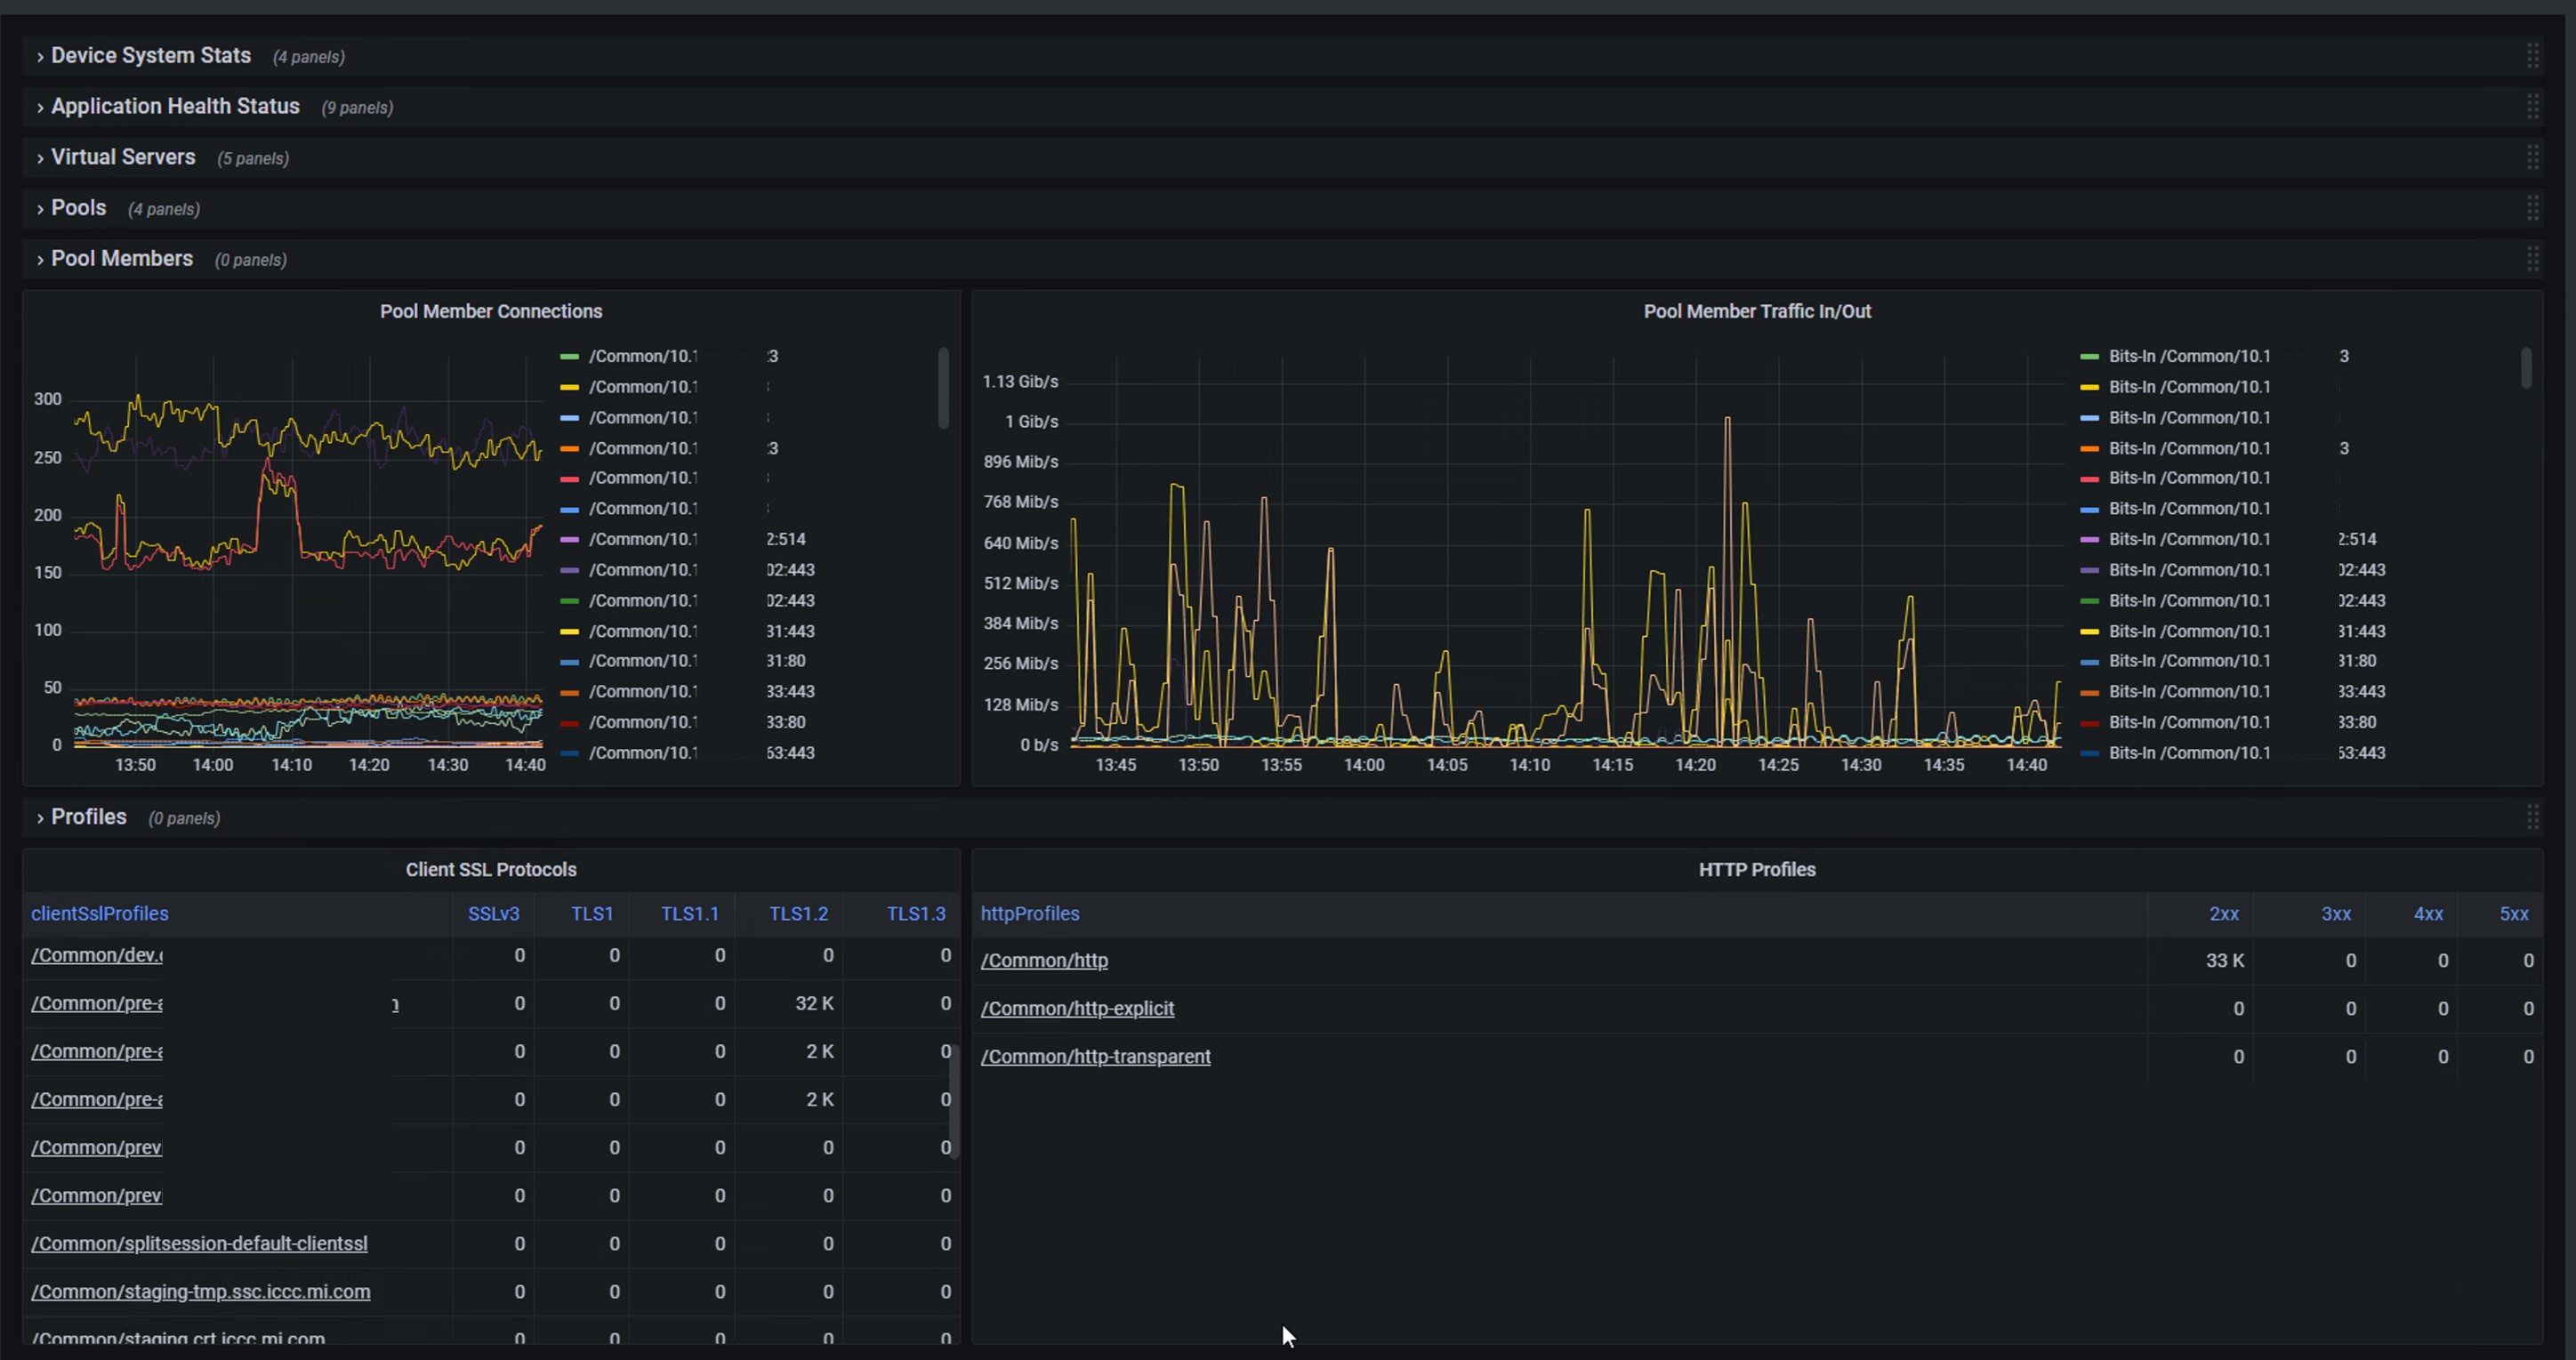
- The status of the backend server member
- Statistics related to system profile, such as TLS and HTTP
Data source config
Collector type:
Collector plugins:
Collector config:
Revisions
Upload an updated version of an exported dashboard.json file from Grafana
| Revision | Description | Created | |
|---|---|---|---|
| Download |
F5 BIG-IP
Easily monitor F5 BIG-IP, a multifaceted application delivery controller (ADC), with Grafana Cloud's out-of-the-box monitoring solution.
Learn more