Hasura HTTP GraphQL
Hasura dashboards for HTTP GraphQL requests
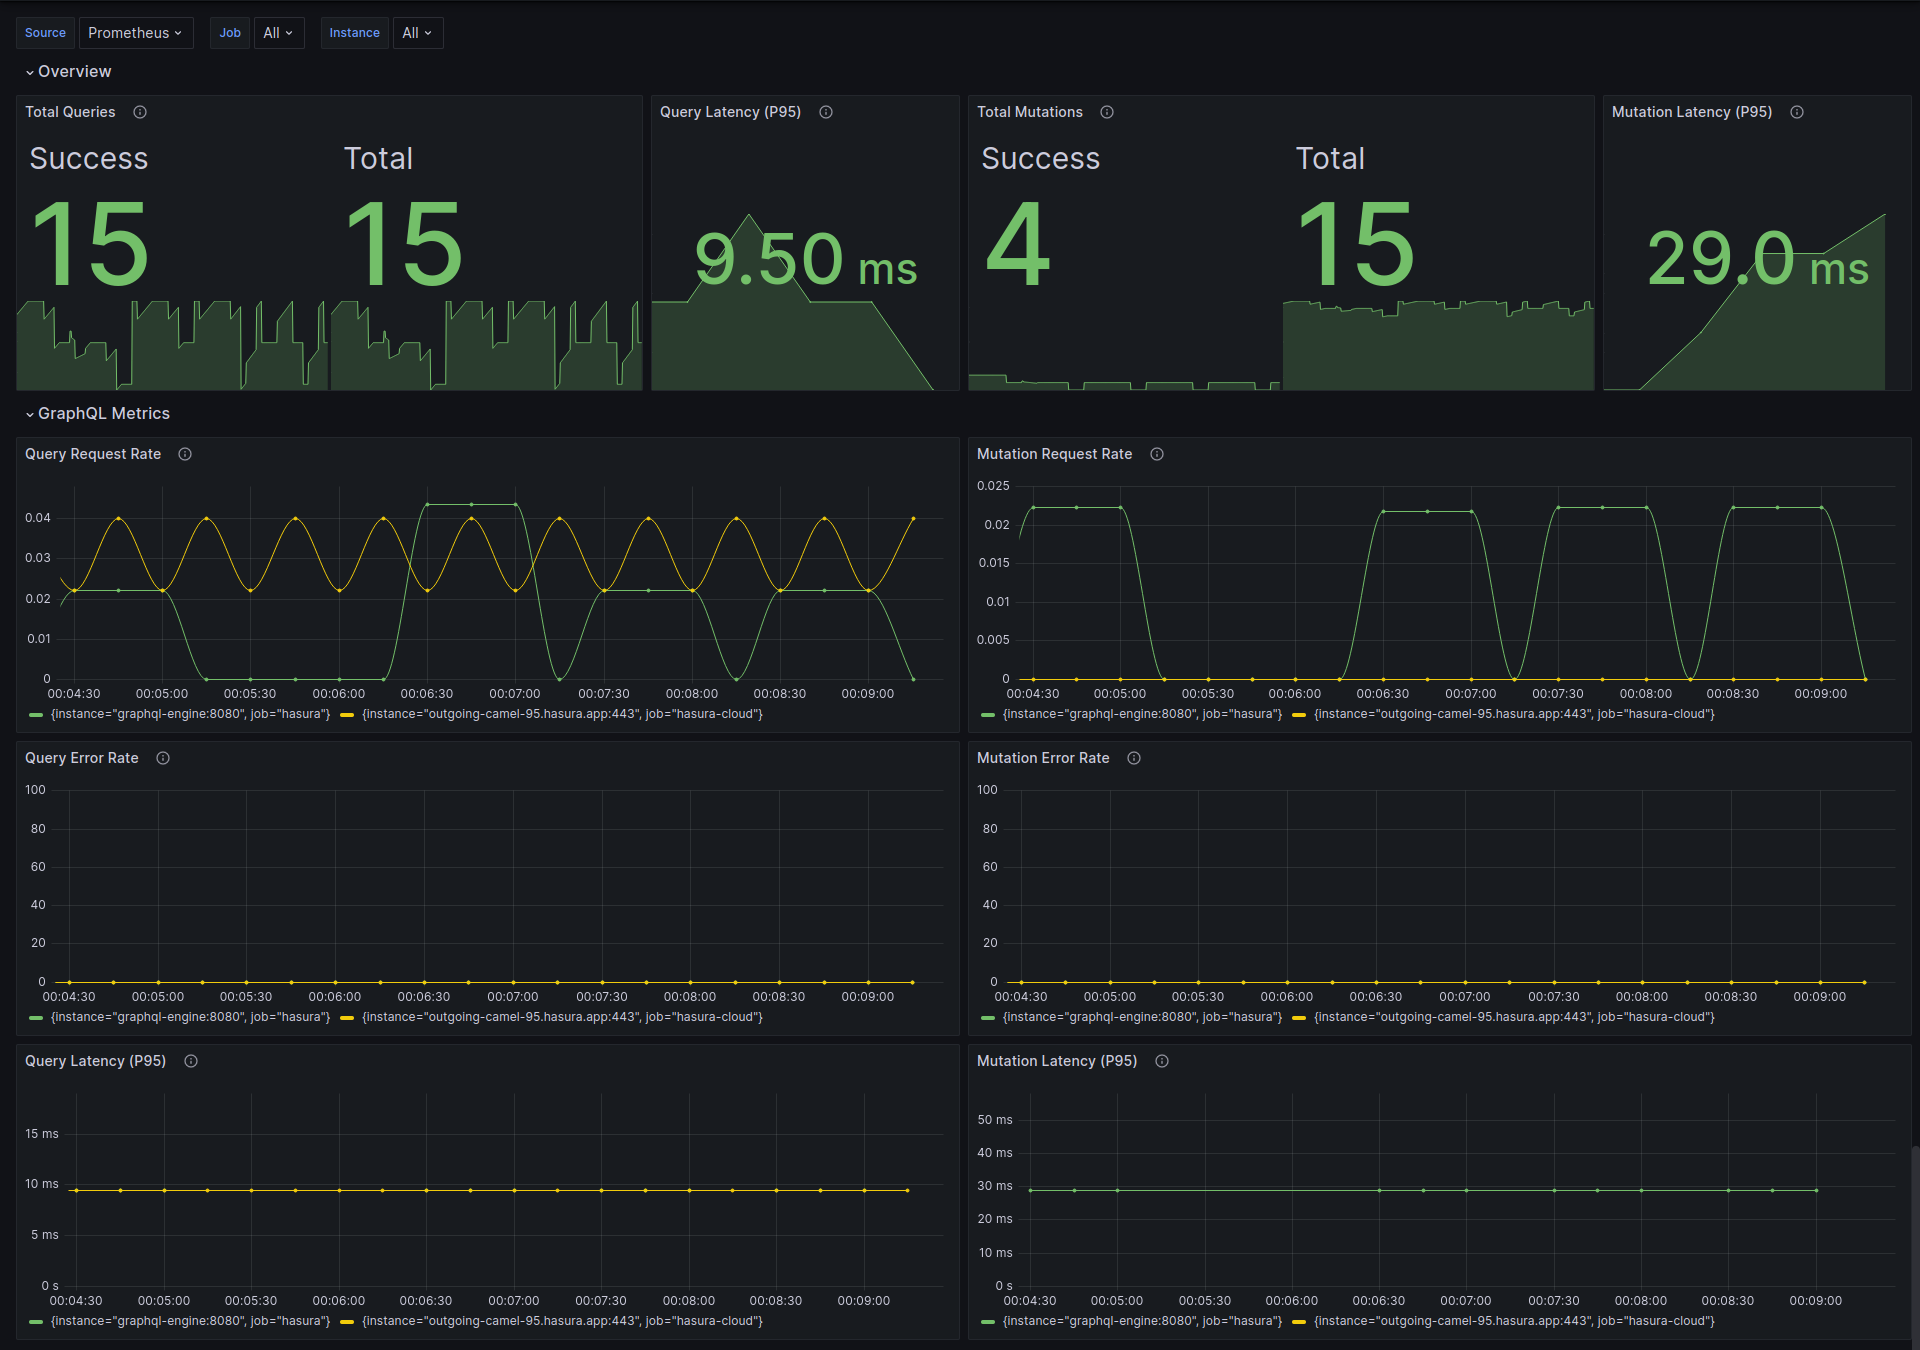
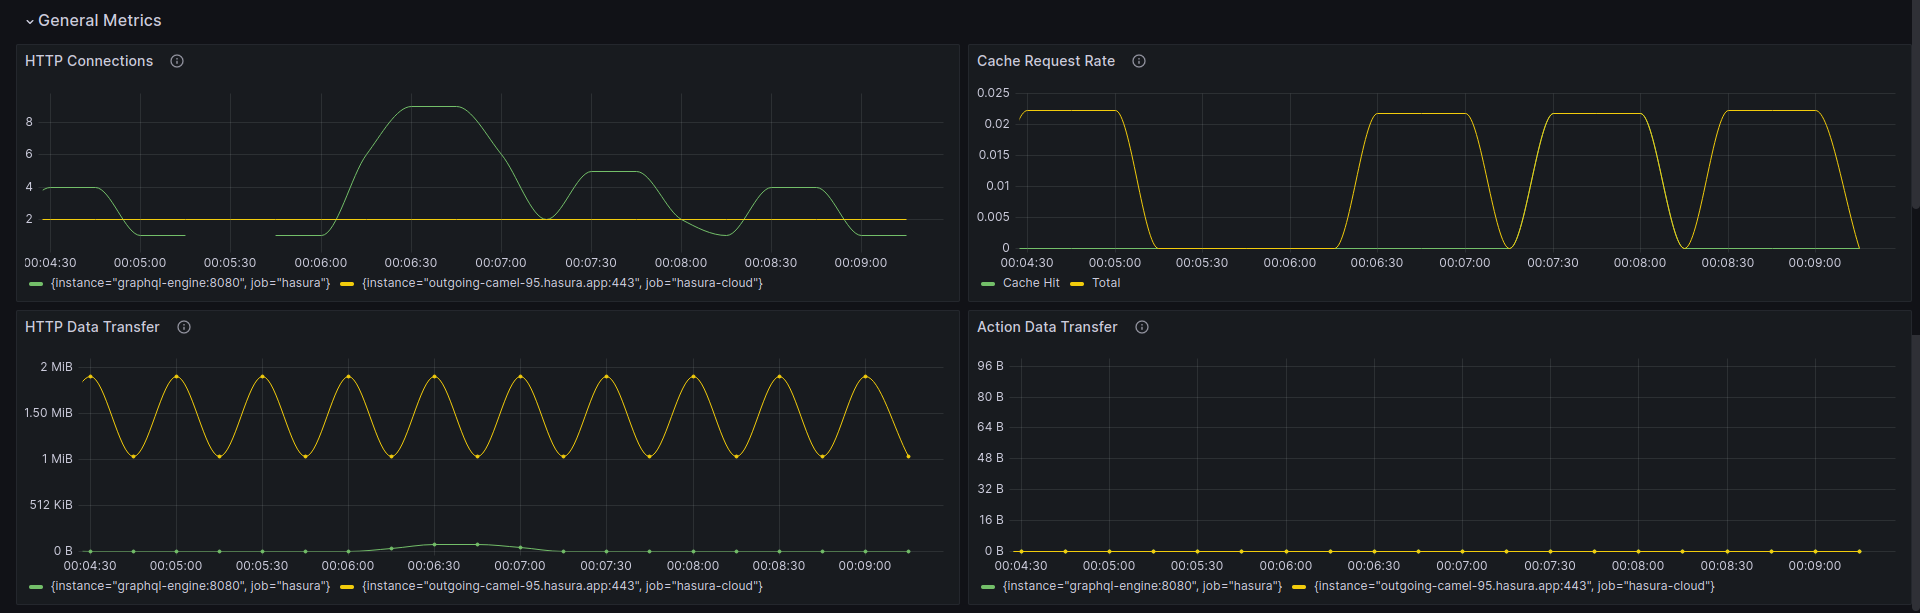
The dashboard visualizes Prometheus metrics about GraphQL requests on HTTP protocol (Query, Mutation) that are emitted from Hasura GraphQL Engine Enterprise Edition. See Prometheus Integration with Hasura EE for more information.
You need to enable Hasura EE with a valid license key. If you don't have one, you can get a license key via a 30-day free trial or by contacting the Hasura team.
Data source config
Collector type:
Collector plugins:
Collector config:
Revisions
Upload an updated version of an exported dashboard.json file from Grafana
| Revision | Description | Created | |
|---|---|---|---|
| Download |
Apache HTTP Server
Easily monitor Apache HTTP Server, an open source HTTP server for modern operating systems including UNIX and Windows, with Grafana Cloud's out-of-the-box monitoring solution.
Learn more