Prometheus
This is a modern 'Prometheus' dashboard for your Kubernetes cluster(s). Made for kube-prometheus-stack and take advantage of the latest Grafana features. GitHub repository: https://github.com/dotdc/grafana-dashboards-kubernetes

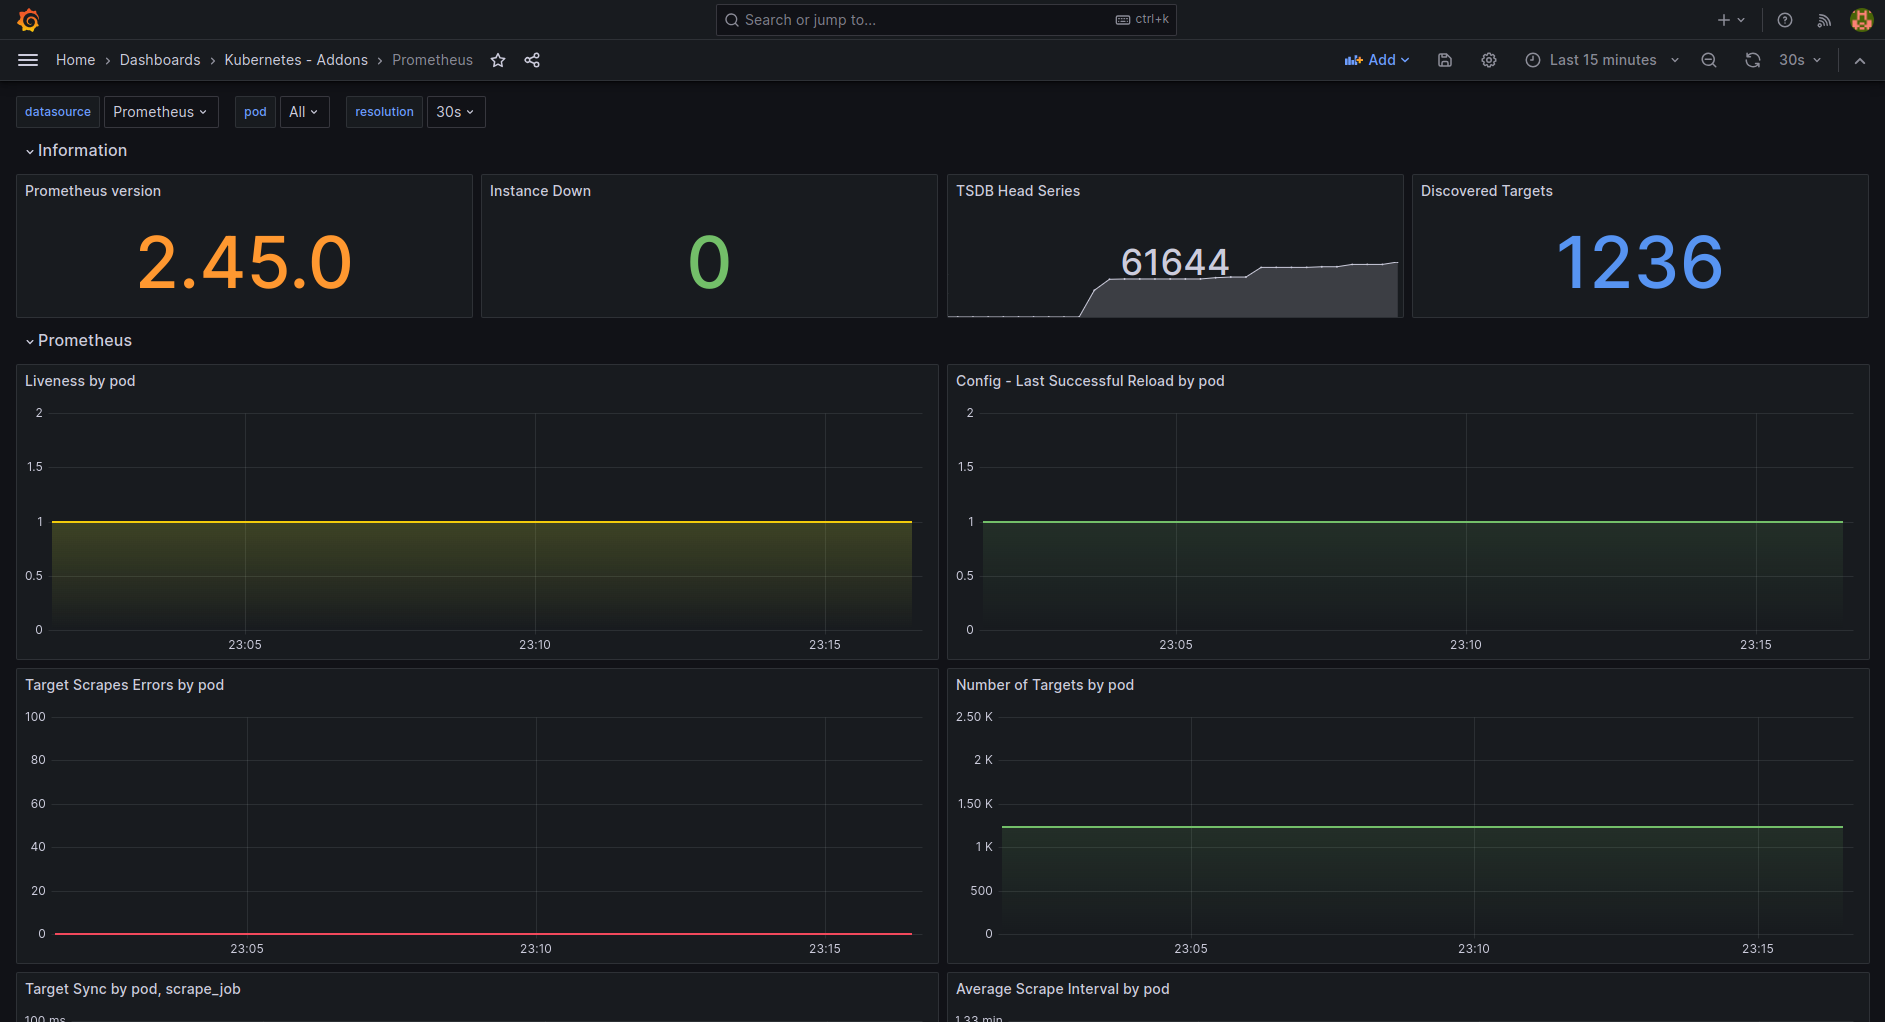
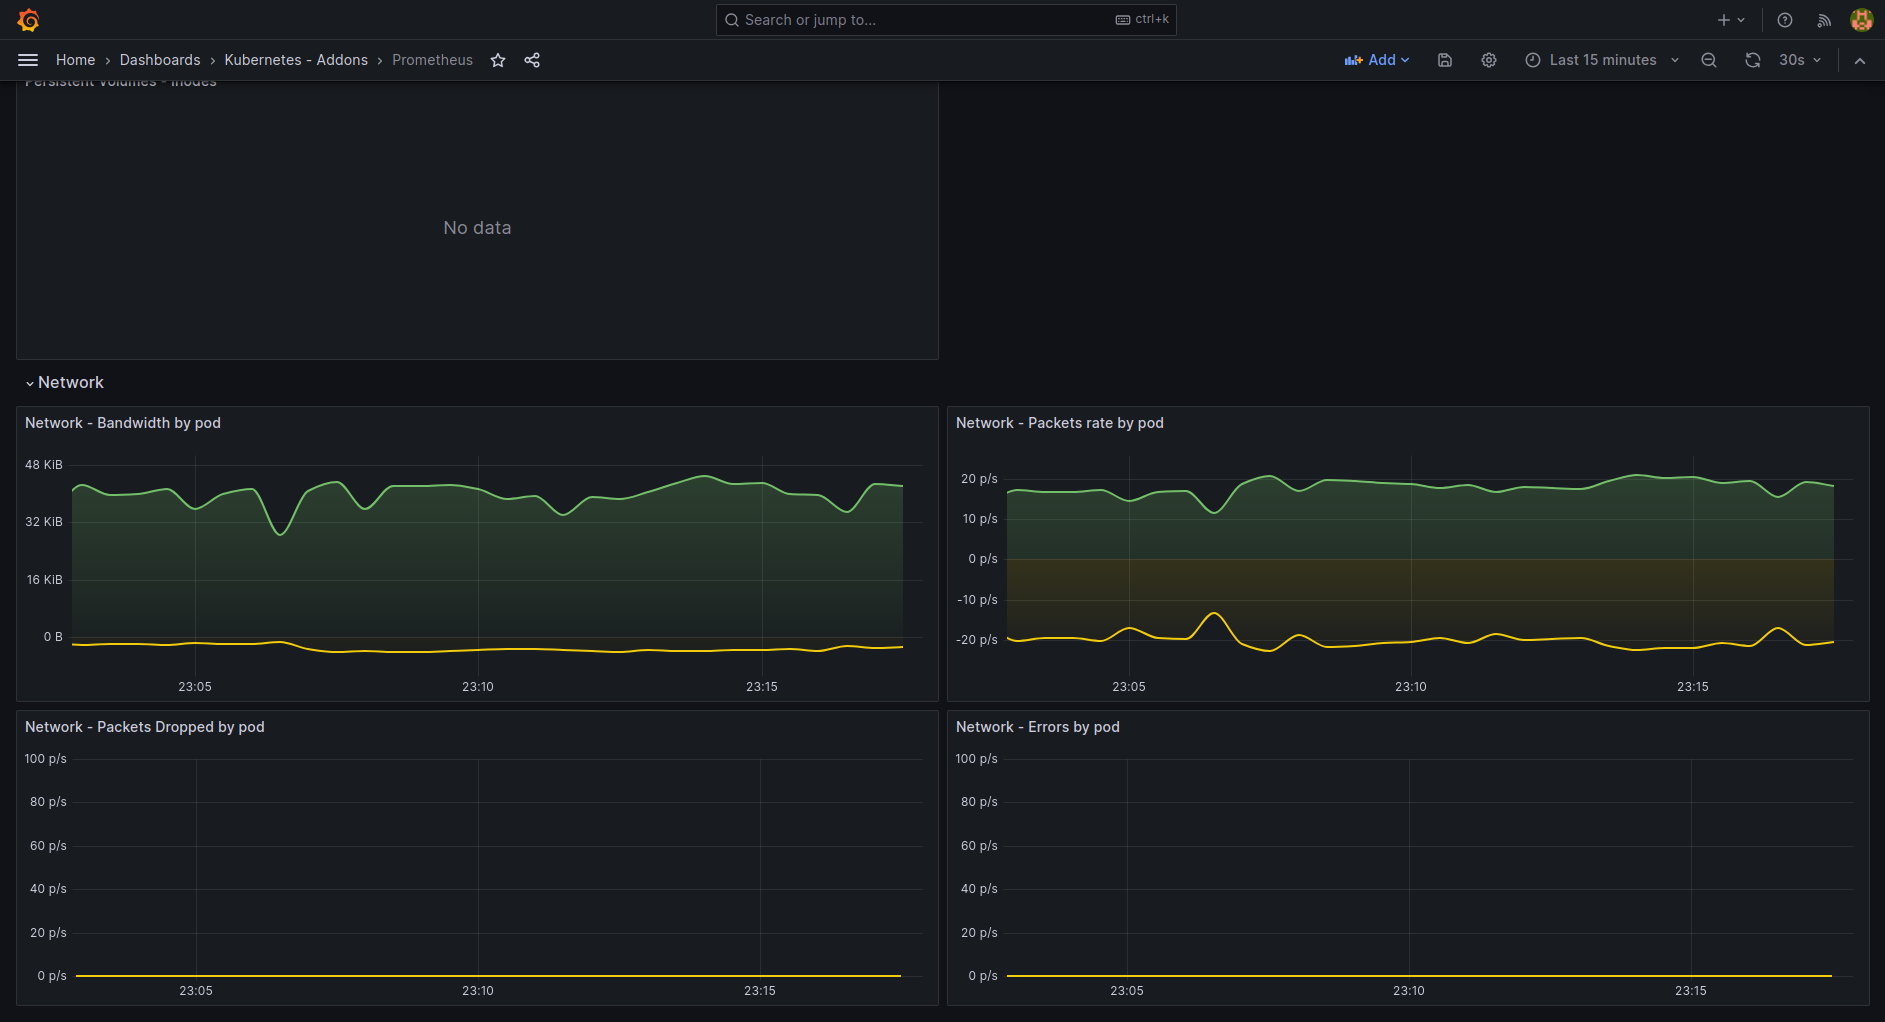
This is a modern dashboard for Prometheus.
Made to take advantage of the latest Grafana features.
GitHub repository: grafana-dashboards-kubernetes
Data source config
Collector type:
Collector plugins:
Collector config:
Revisions
Upload an updated version of an exported dashboard.json file from Grafana
| Revision | Description | Created | |
|---|---|---|---|
| Download |
Metrics Endpoint (Prometheus)
Easily monitor any Prometheus-compatible and publicly accessible metrics URL with Grafana Cloud's out-of-the-box monitoring solution.
Learn more