Appian Health Cloud Metrics
Cloud metrics for Appian environment. For help with setup and installation, please reach to: aamores@deftconsultinginc.com
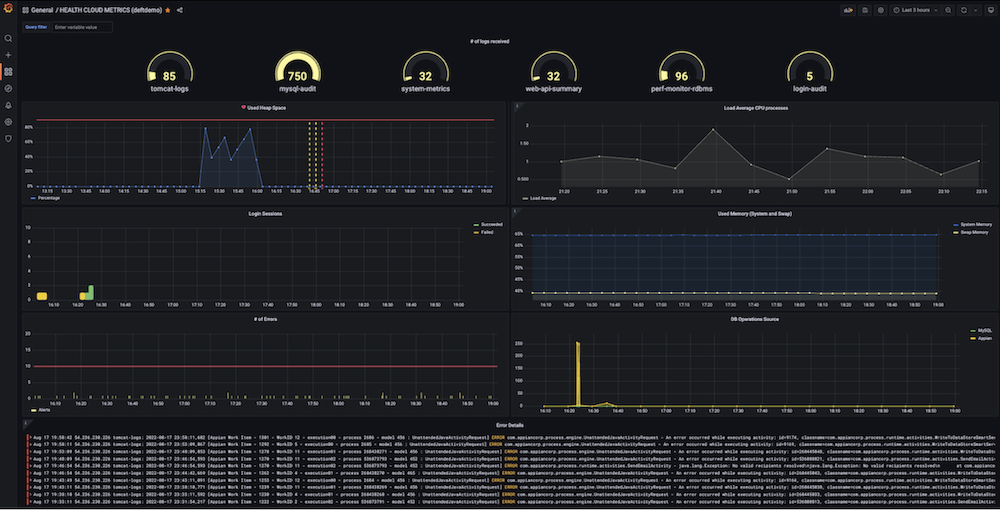
Deft Consulting’s Appian Monitoring Dashboards with Grafana integrates Appian raw logs and orchestrates them in graphic charts and metrics useful for real-time backend monitoring. Using syslog-ng, Promtail and Loki; Appian raw logs are ingested into Grafana and show complex but easy-to-read dashboards that will provide visibility of the behavior of the Appian instance. This will enable them to easily identify potential problems in order to take preventive measures and ensure they stick to organization-wide standards. The tool also provides real time alerts to notify engineers and allow them to immediately correct existing problems that could be critical to the environment, such as database performance, overall usage, failed login attempts, integration issues, among others. For help with setup and installation, please reach to: aamores@deftconsultinginc.com
Data source config
Collector config:
Upload an updated version of an exported dashboard.json file from Grafana
| Revision | Description | Created | |
|---|---|---|---|
| Download |