Telegraf & Influx Windows Host Overview
Windows host dashboard for telegraf metrics pumped into influxdb
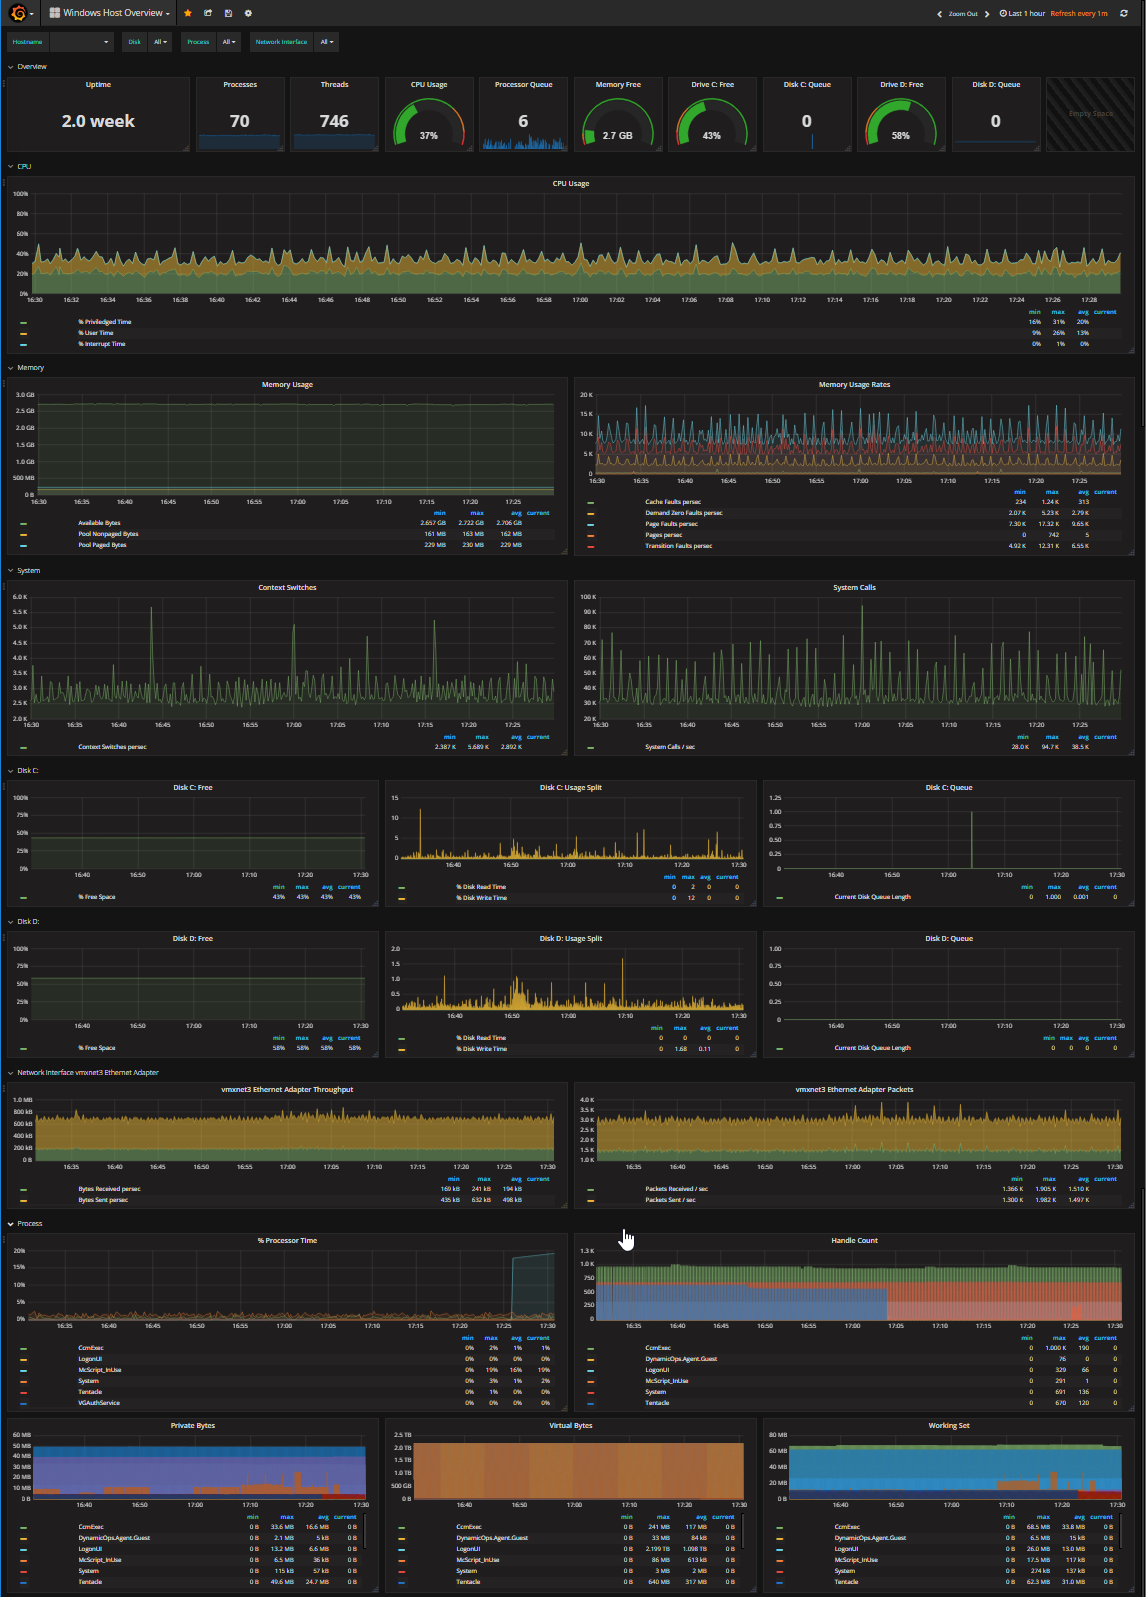
A pretty (and functional!) dashboard for gaining a deep insight into the state of a Windows host.
The dashboard requires stats pumped in from Telegraf and stored in Influxdb, using the config supplied here - without it you'll find you have a few empty panels.
Inspired by Lex Rivera's Telegraf System Overview and Matt Saunders' Telegraf Windows Instances
Source available at Github
Data source config
Collector type:
Collector plugins:
Collector config:
Revisions
Upload an updated version of an exported dashboard.json file from Grafana
| Revision | Description | Created | |
|---|---|---|---|
| Download |
Windows
Easily monitor your deployment of the Windows operating system with Grafana Cloud's out-of-the-box monitoring solution.
Learn more