Multi Cluster View
Multi Cluster view dashboard helps visualise multiple clusters across regions and data centers with focus on health as well as alerts and errors associated with them
Multi cluster view dashboard for Aerospike Monitoring Stack
Multi cluster view dashboard, this visualise multiple cluster across regions and data centers with focus on health, for this Dashboard to work,
- Cluster-name has to be configured within your Aerospike cluster, and
- Latitude and Longitude of the cluster location are to be configured within the Aerospike Prometheus Exporter
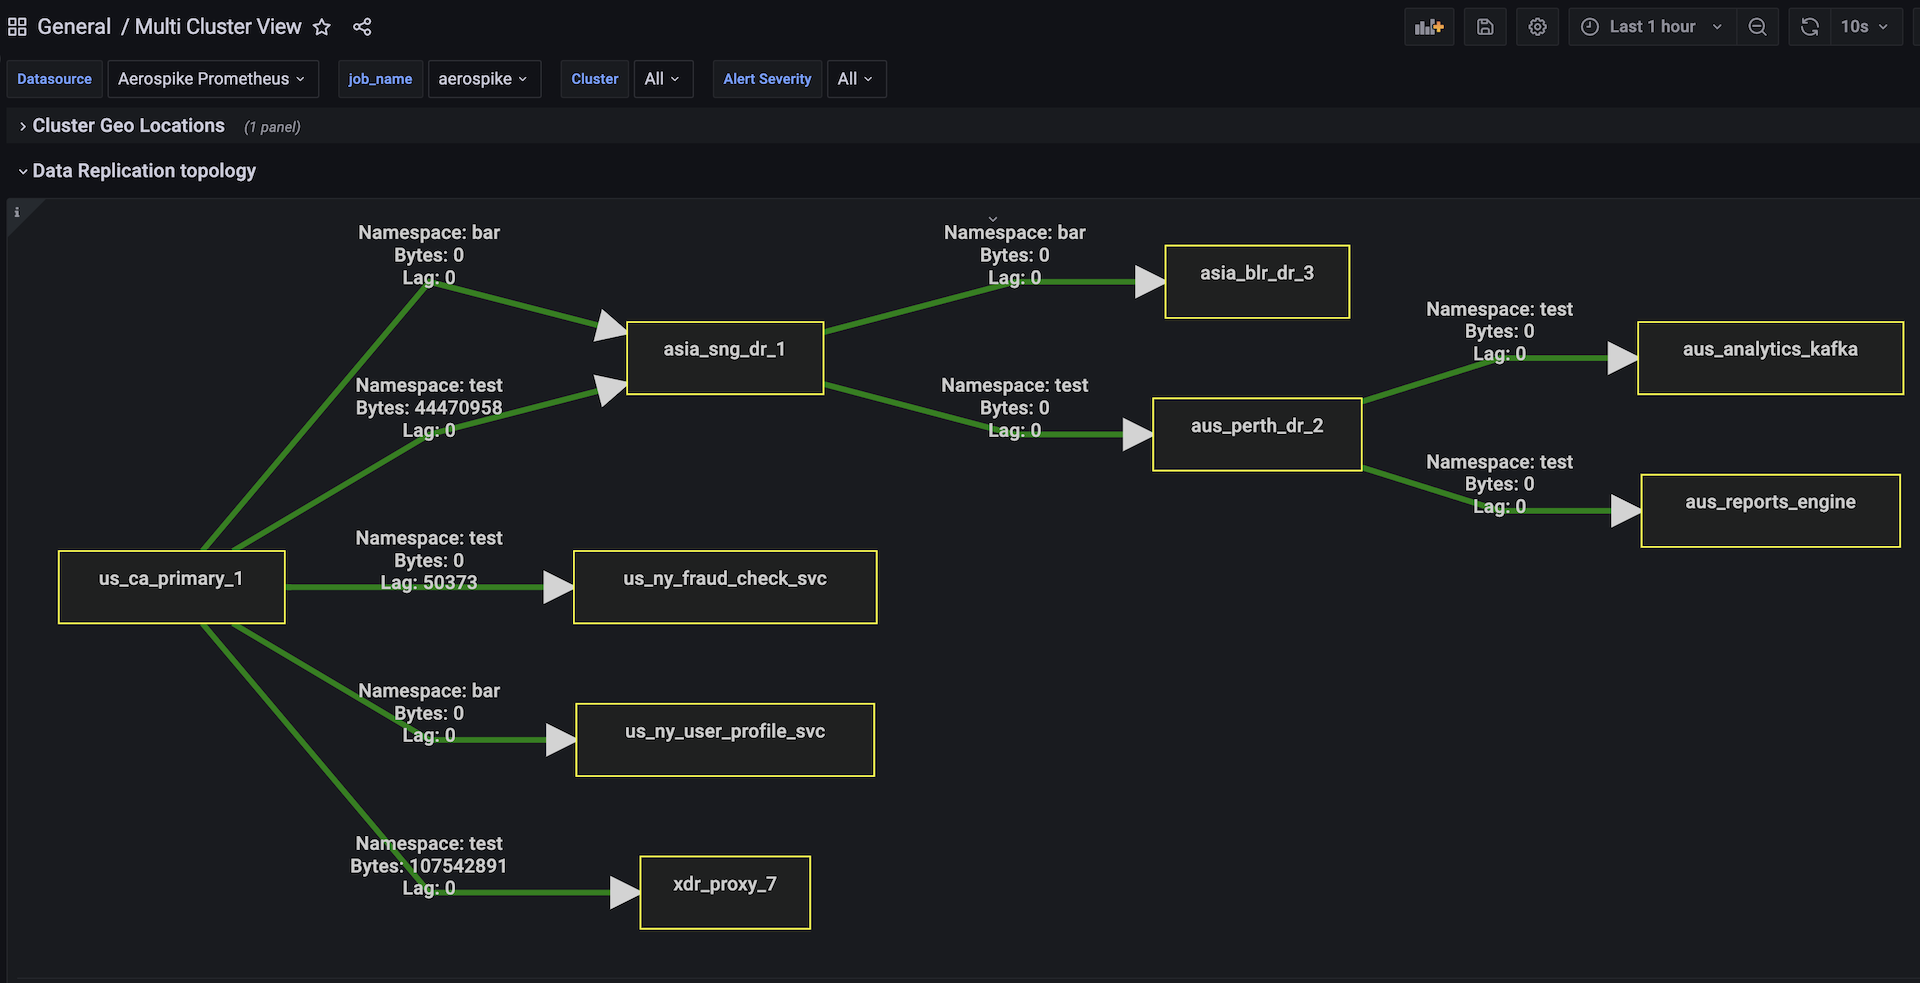
Data Replication topology panel display the data flow configured between each aerospike cluster and the xdr dc configured. world-map view and the topology panel needs cluster-name is configured and the destination cluster-name is same as the xdr-dc name in the xdr configuration section of Aerospike server NOTE: This dashboard required 2 external plugins to be installed "grafana-polystat-panel" and "jdbranham-diagram-panel"
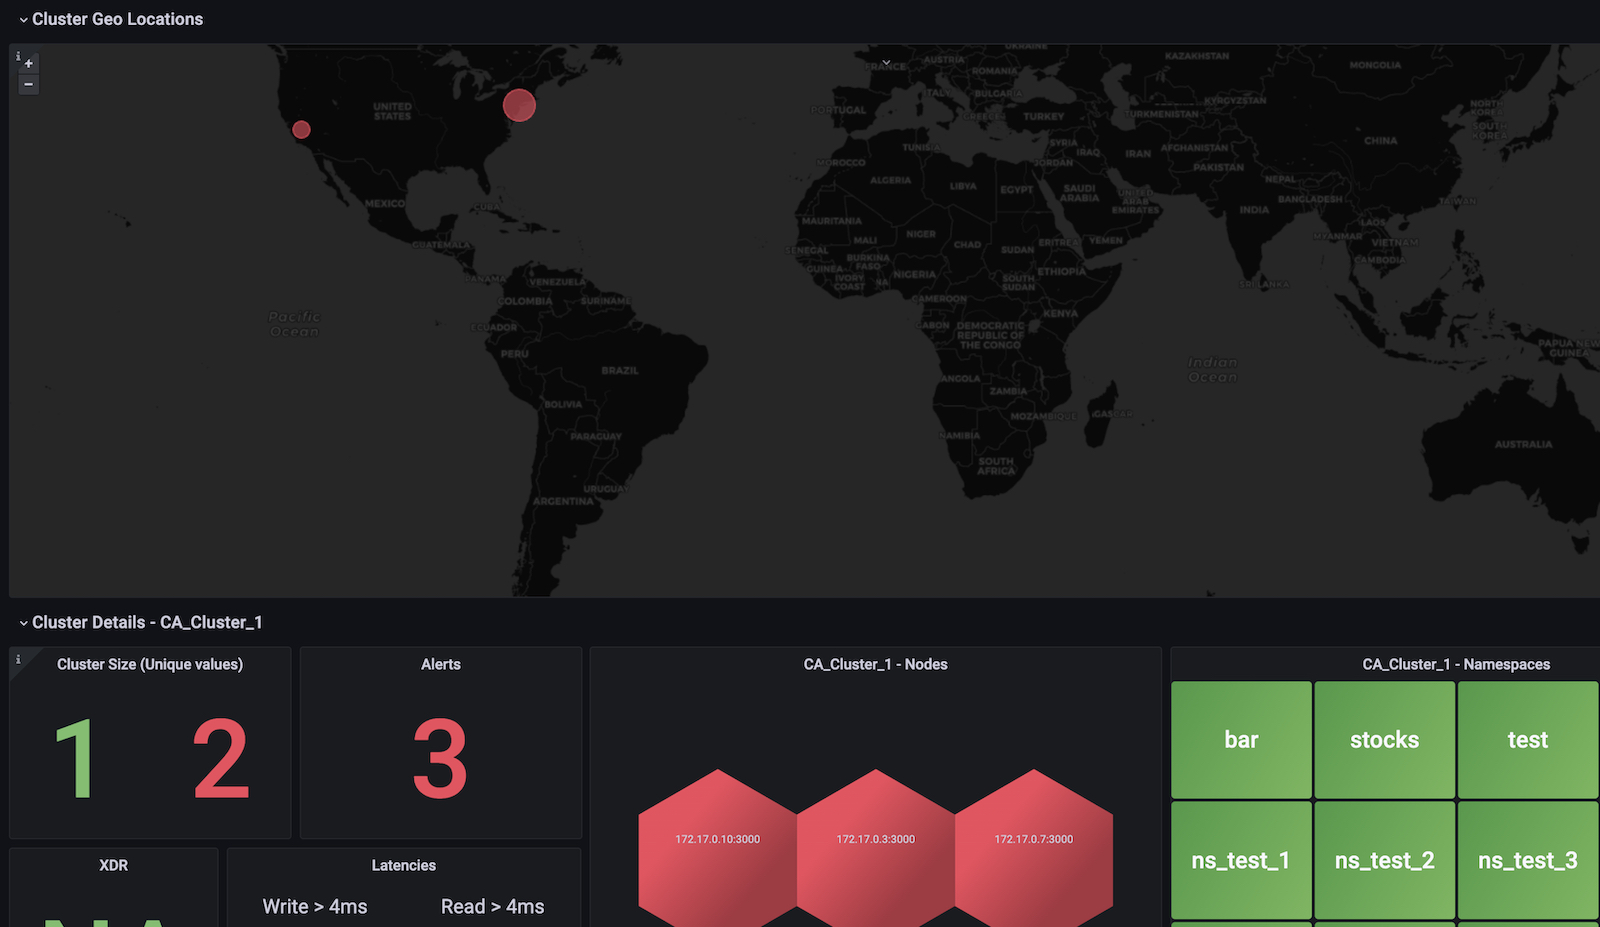
This dashboard consists of 4 panels. - Geomap panel - displays multiple cluster view - Cluster panel displays key metrics like size, alerts, XDR lag, Read & Write latencies - Node panel uses Polystat plugin and displays nodes in Green or Red indicating the health - Namespace panel displays namespaces in Green or Red indicating the health
NOTE: Polestar plugin is required and installed in Grafana for this dashboard.
See Aerospike Monitoring Stack Architecture and Aerospike Monitoring Stack Installation for more details
Data source config
Collector config:
Upload an updated version of an exported dashboard.json file from Grafana
| Revision | Description | Created | |
|---|---|---|---|
| Download |