GitLab Self-managed - Machine Performance
Self-defined Dashboard for nodes of GitLab
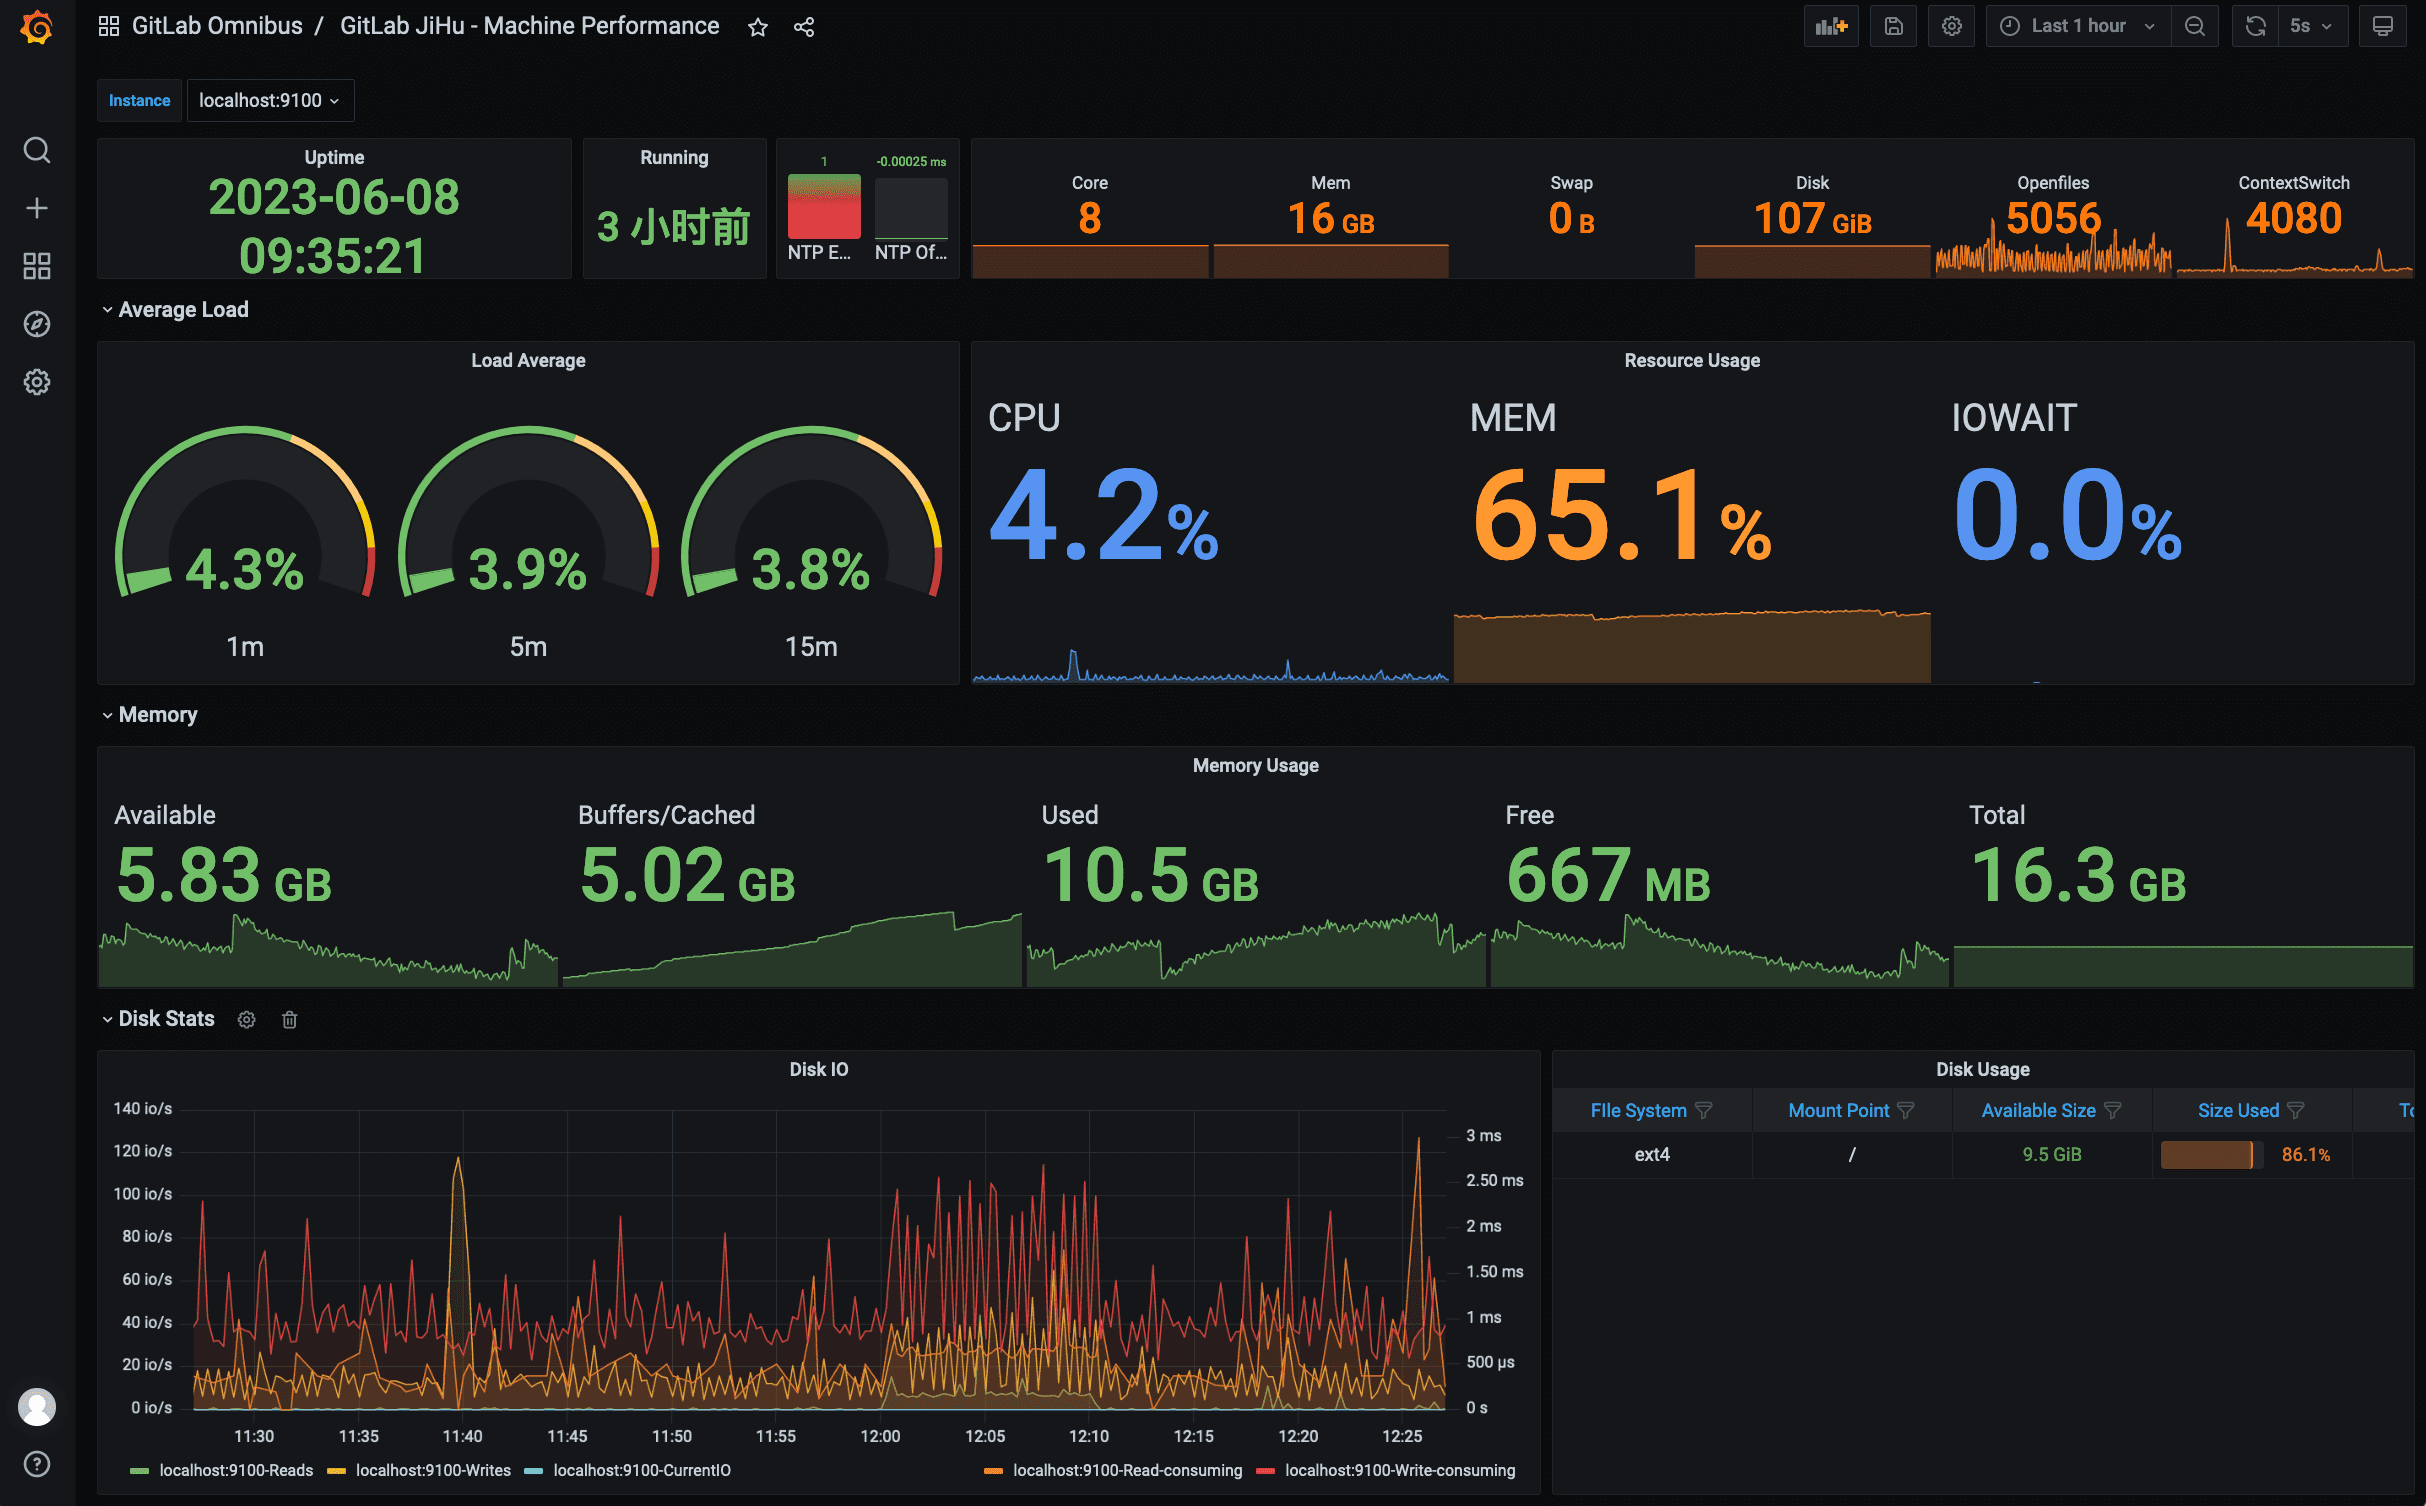
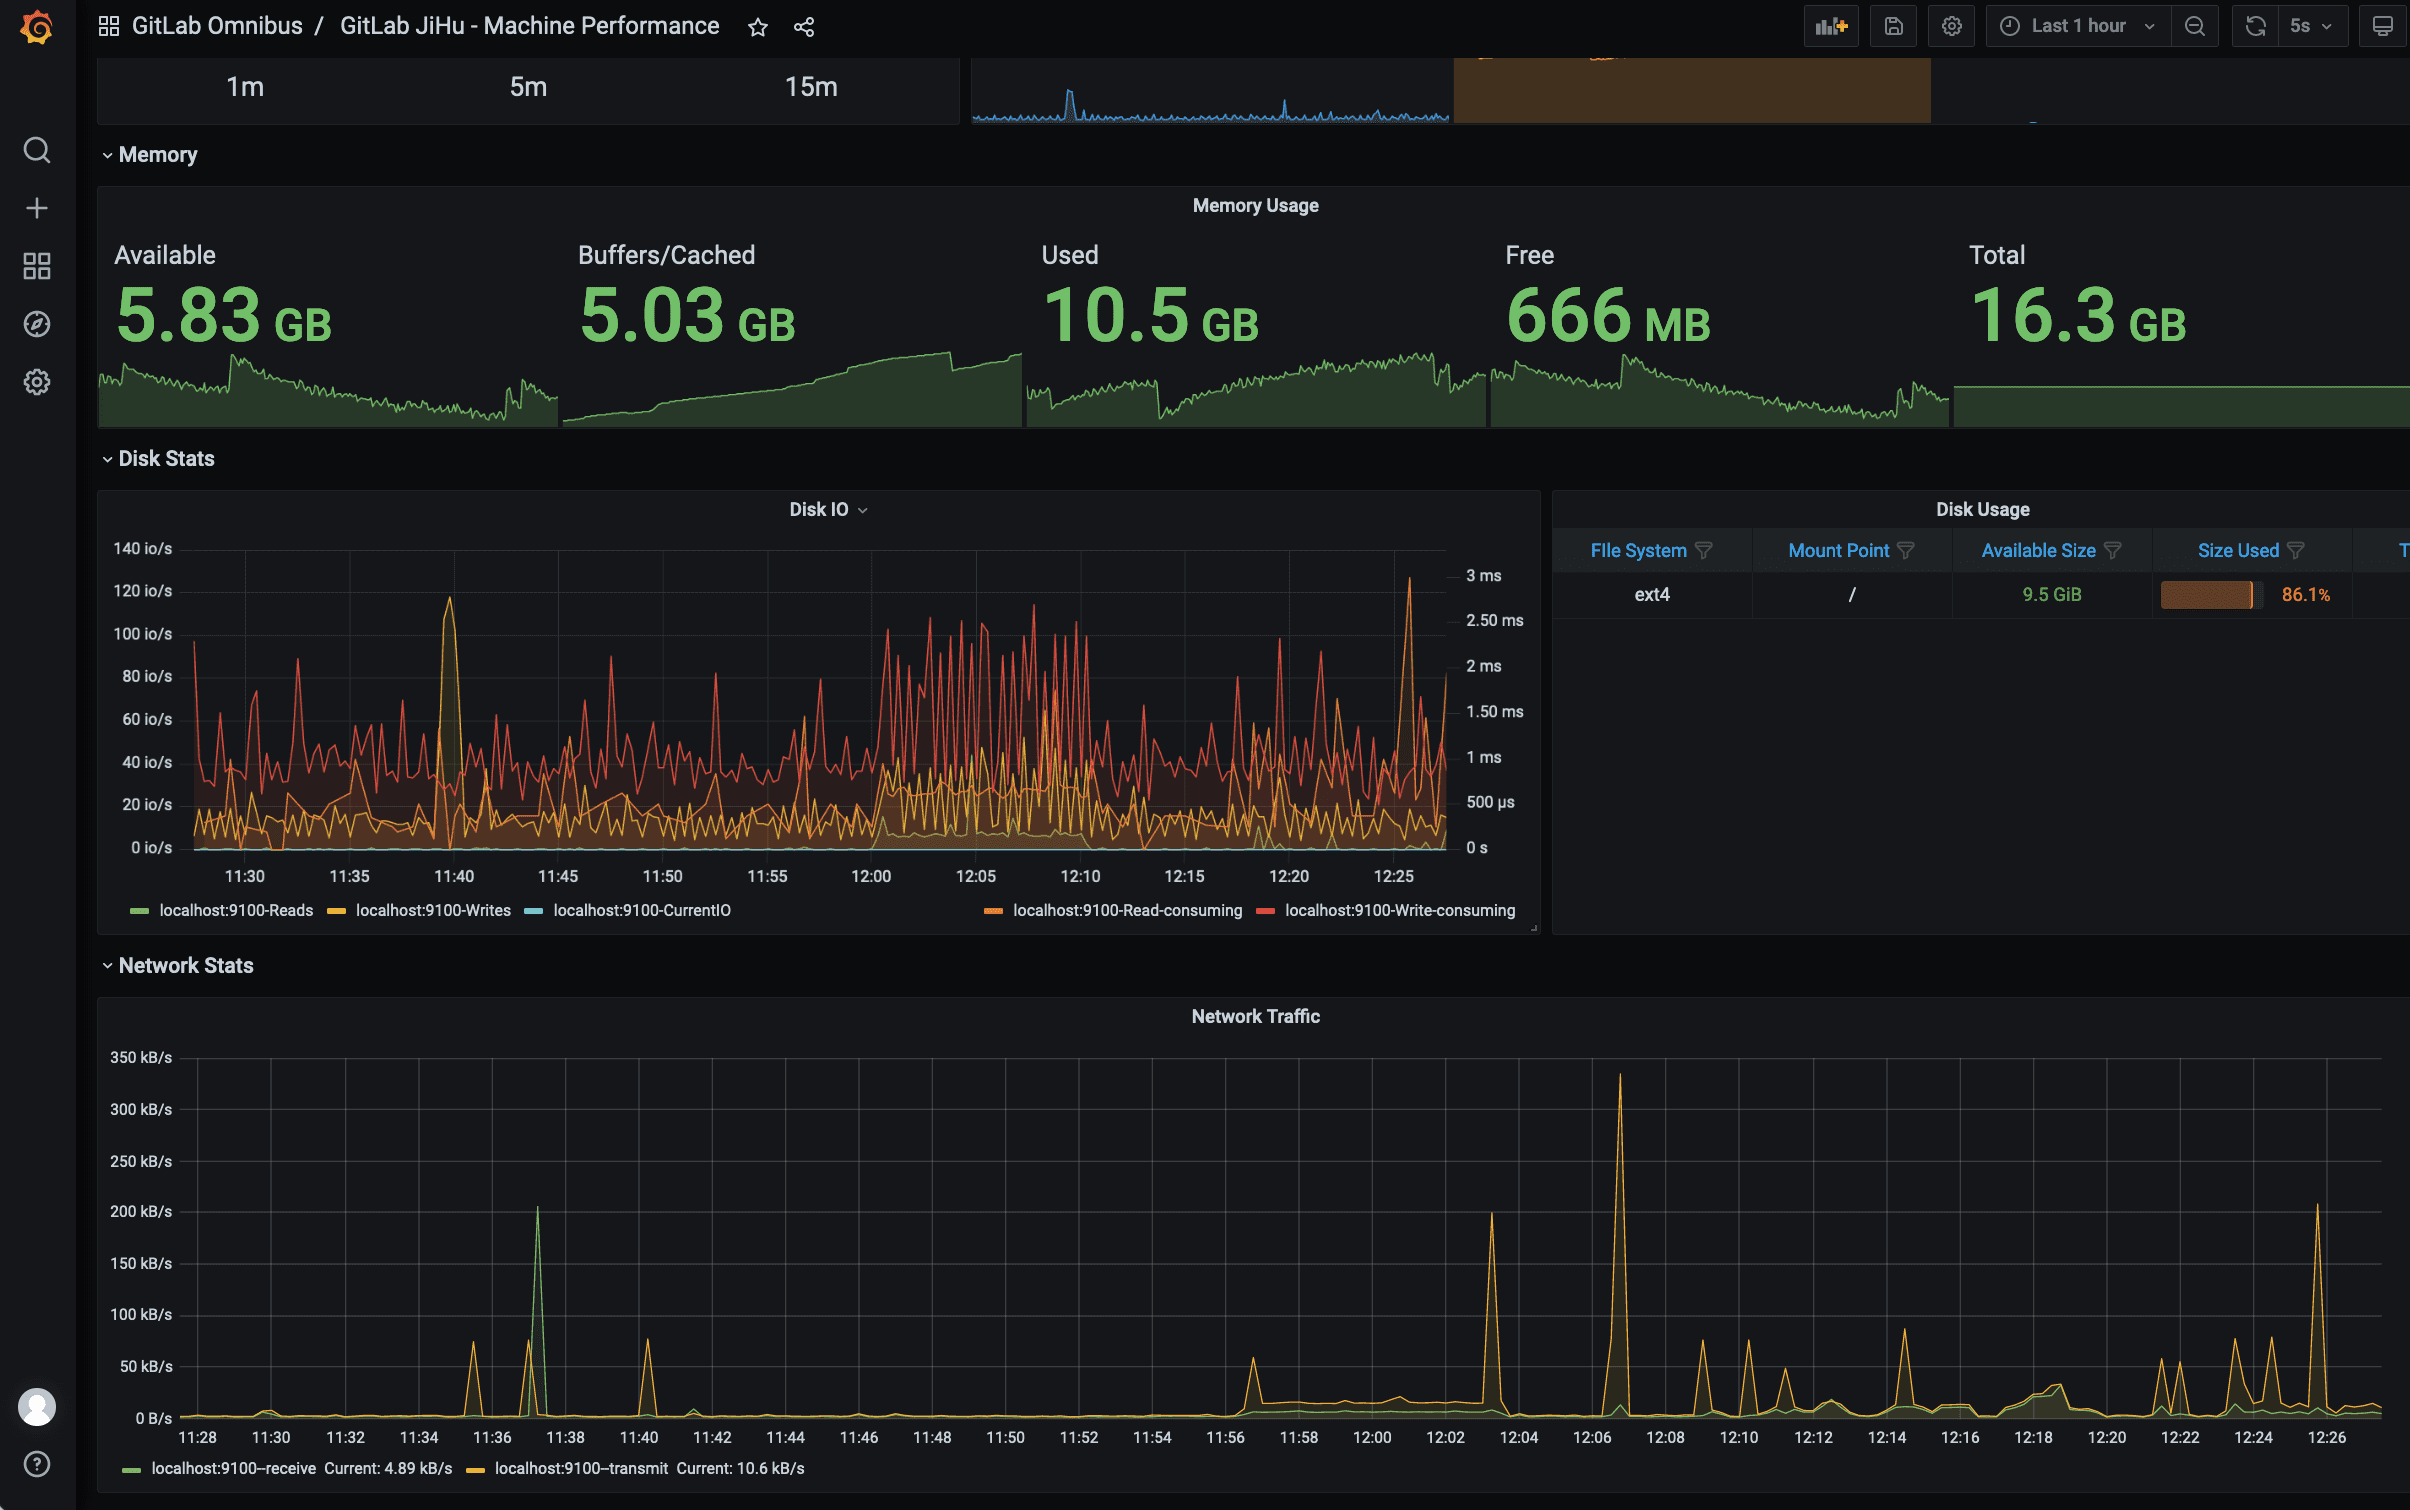
The GitLab Self-managed - Machine Performance dashboard uses the prometheus data source to create a Grafana dashboard with the bargauge, gauge, graph, stat, table and timeseries panels.
Data source config
Collector type:
Collector plugins:
Collector config:
Revisions
Upload an updated version of an exported dashboard.json file from Grafana
| Revision | Description | Created | |
|---|---|---|---|
| Download |
GitLab
Monitor GitLab with Grafana. Easily monitor your GitLab Enterprise Edition with Grafana Cloud's out-of-the-box monitoring solution.
Learn more