JVM Overview (Micrometer OTLP)
Dashboard for JVM metrics with Spring Boot OTLP metric exporter
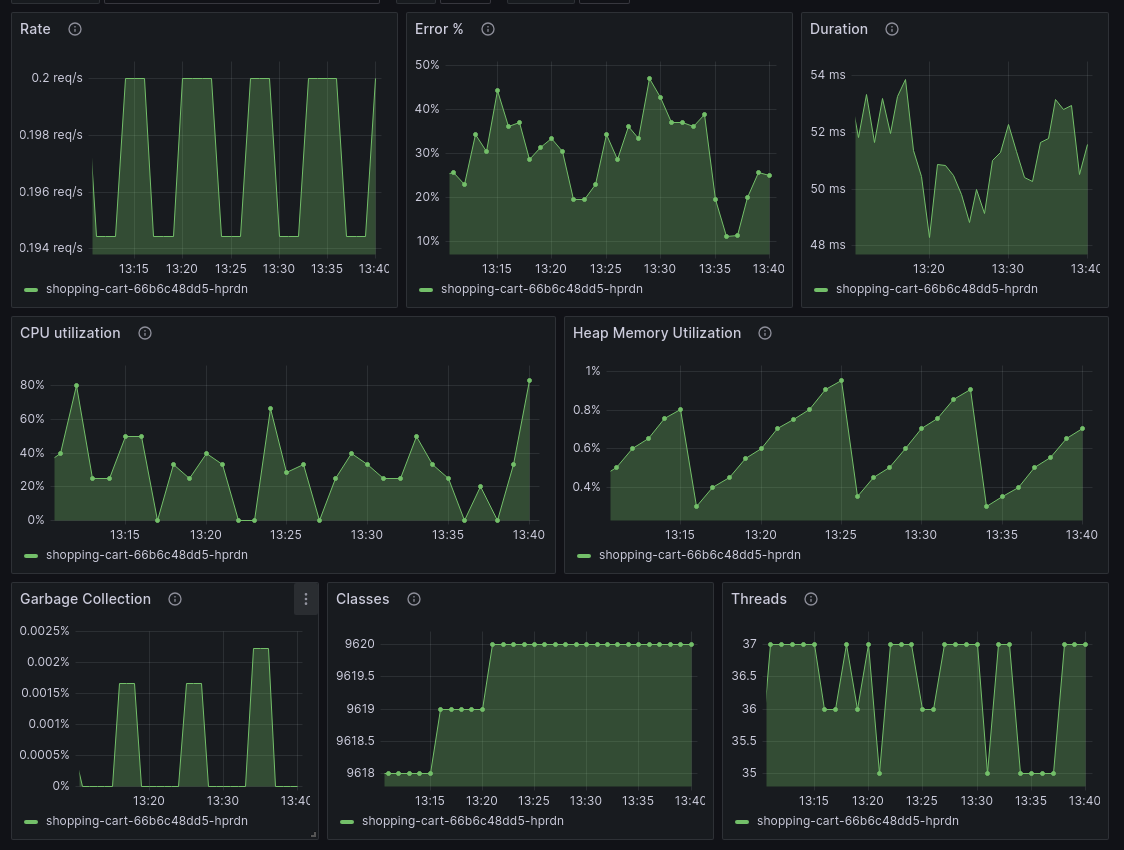
Overview for the most important JVM and HTTP server metrics.
JVM metrics: CPU, memory, classes, threads, and garbage collection.
HTTP server is monitored using RED - Request rate, Error ratio, Duration (latency).
How to send data:
- Spring Boot 3.1+
- Add the Grafana OpenTelemetry Starter to your application
- Use the Grafana Agent to send data to a Prometheus instance
- for Grafana cloud, you can use "Connect Data" from the Grafana home page and then choose "OpenTelemetry (OTLP)"
- for Grafana Open Source, use this guide
Data source config
Collector type:
Collector plugins:
Collector config:
Revisions
Upload an updated version of an exported dashboard.json file from Grafana
| Revision | Description | Created | |
|---|---|---|---|
| Download |
Java Virtual Machine (JVM)
Easily monitor a Java virtual machine, which allows computers to run Java programs, with Grafana Cloud's out-of-the-box monitoring solution.
Learn more