Grafana Dashboard for Veeam Backup & Replication
Grafana Dashboard for Veeam Backup & Replication REST API.
Attention - This Dashboard has been built for InfluxDB v2.0 using Flux
Requires Veeam Enterprise Plus or VUL licensing
Just download the latest Veeam Enterprise Manager script version from GitHub https://raw.githubusercontent.com/jorgedlcruz/veeam-backup-and-replication-grafana/main/veeam_backup_and_replication.sh and change the Configuration section within your details:
##
# Configurations
##
# Endpoint URL for InfluxDB
veeamInfluxDBURL="http://YOURINFLUXSERVERIP" #Your InfluxDB Server, http://FQDN or https://FQDN if using SSL
veeamInfluxDBPort="8086" #Default Port
veeamInfluxDBBucket="veeam" # InfluxDB bucket name (not ID)
veeamInfluxDBToken="TOKEN" # InfluxDB access token with read/write privileges for the bucket
veeamInfluxDBOrg="ORG NAME" # InfluxDB organisation name (not ID)
Endpoint URL for login action
veeamJobSessions="1000"
veeamUsername="YOURVBRUSER"
veeamPassword="YOURVBRPASSWORD"
veeamBackupServer="YOURVBRAPIPORT"
veeamBackupPort="9419" #Default Port
Once the changes are done, make the script executable with chmod:
chmod +x veeam_backup_and_replication.sh
The output of the command should be something like the next, without errors:
Writing veeam_vbr_info to InfluxDB
Writing veeam_vbr_sessions to InfluxDB
Writing veeam_vbr_sessions to InfluxDB
Writing veeam_vbr_sessions to InfluxDB
Writing veeam_vbr_sessions to InfluxDB
Writing veeam_vbr_sessions to InfluxDB
Writing veeam_vbr_sessions to InfluxDB
If so, please now add this script to your crontab, like for example every 30 minutes:
*/30 * * * * * /home/oper/veeam_backup_and_replication.sh >> /var/log/veeam_backup_and_replication.log 2>&1
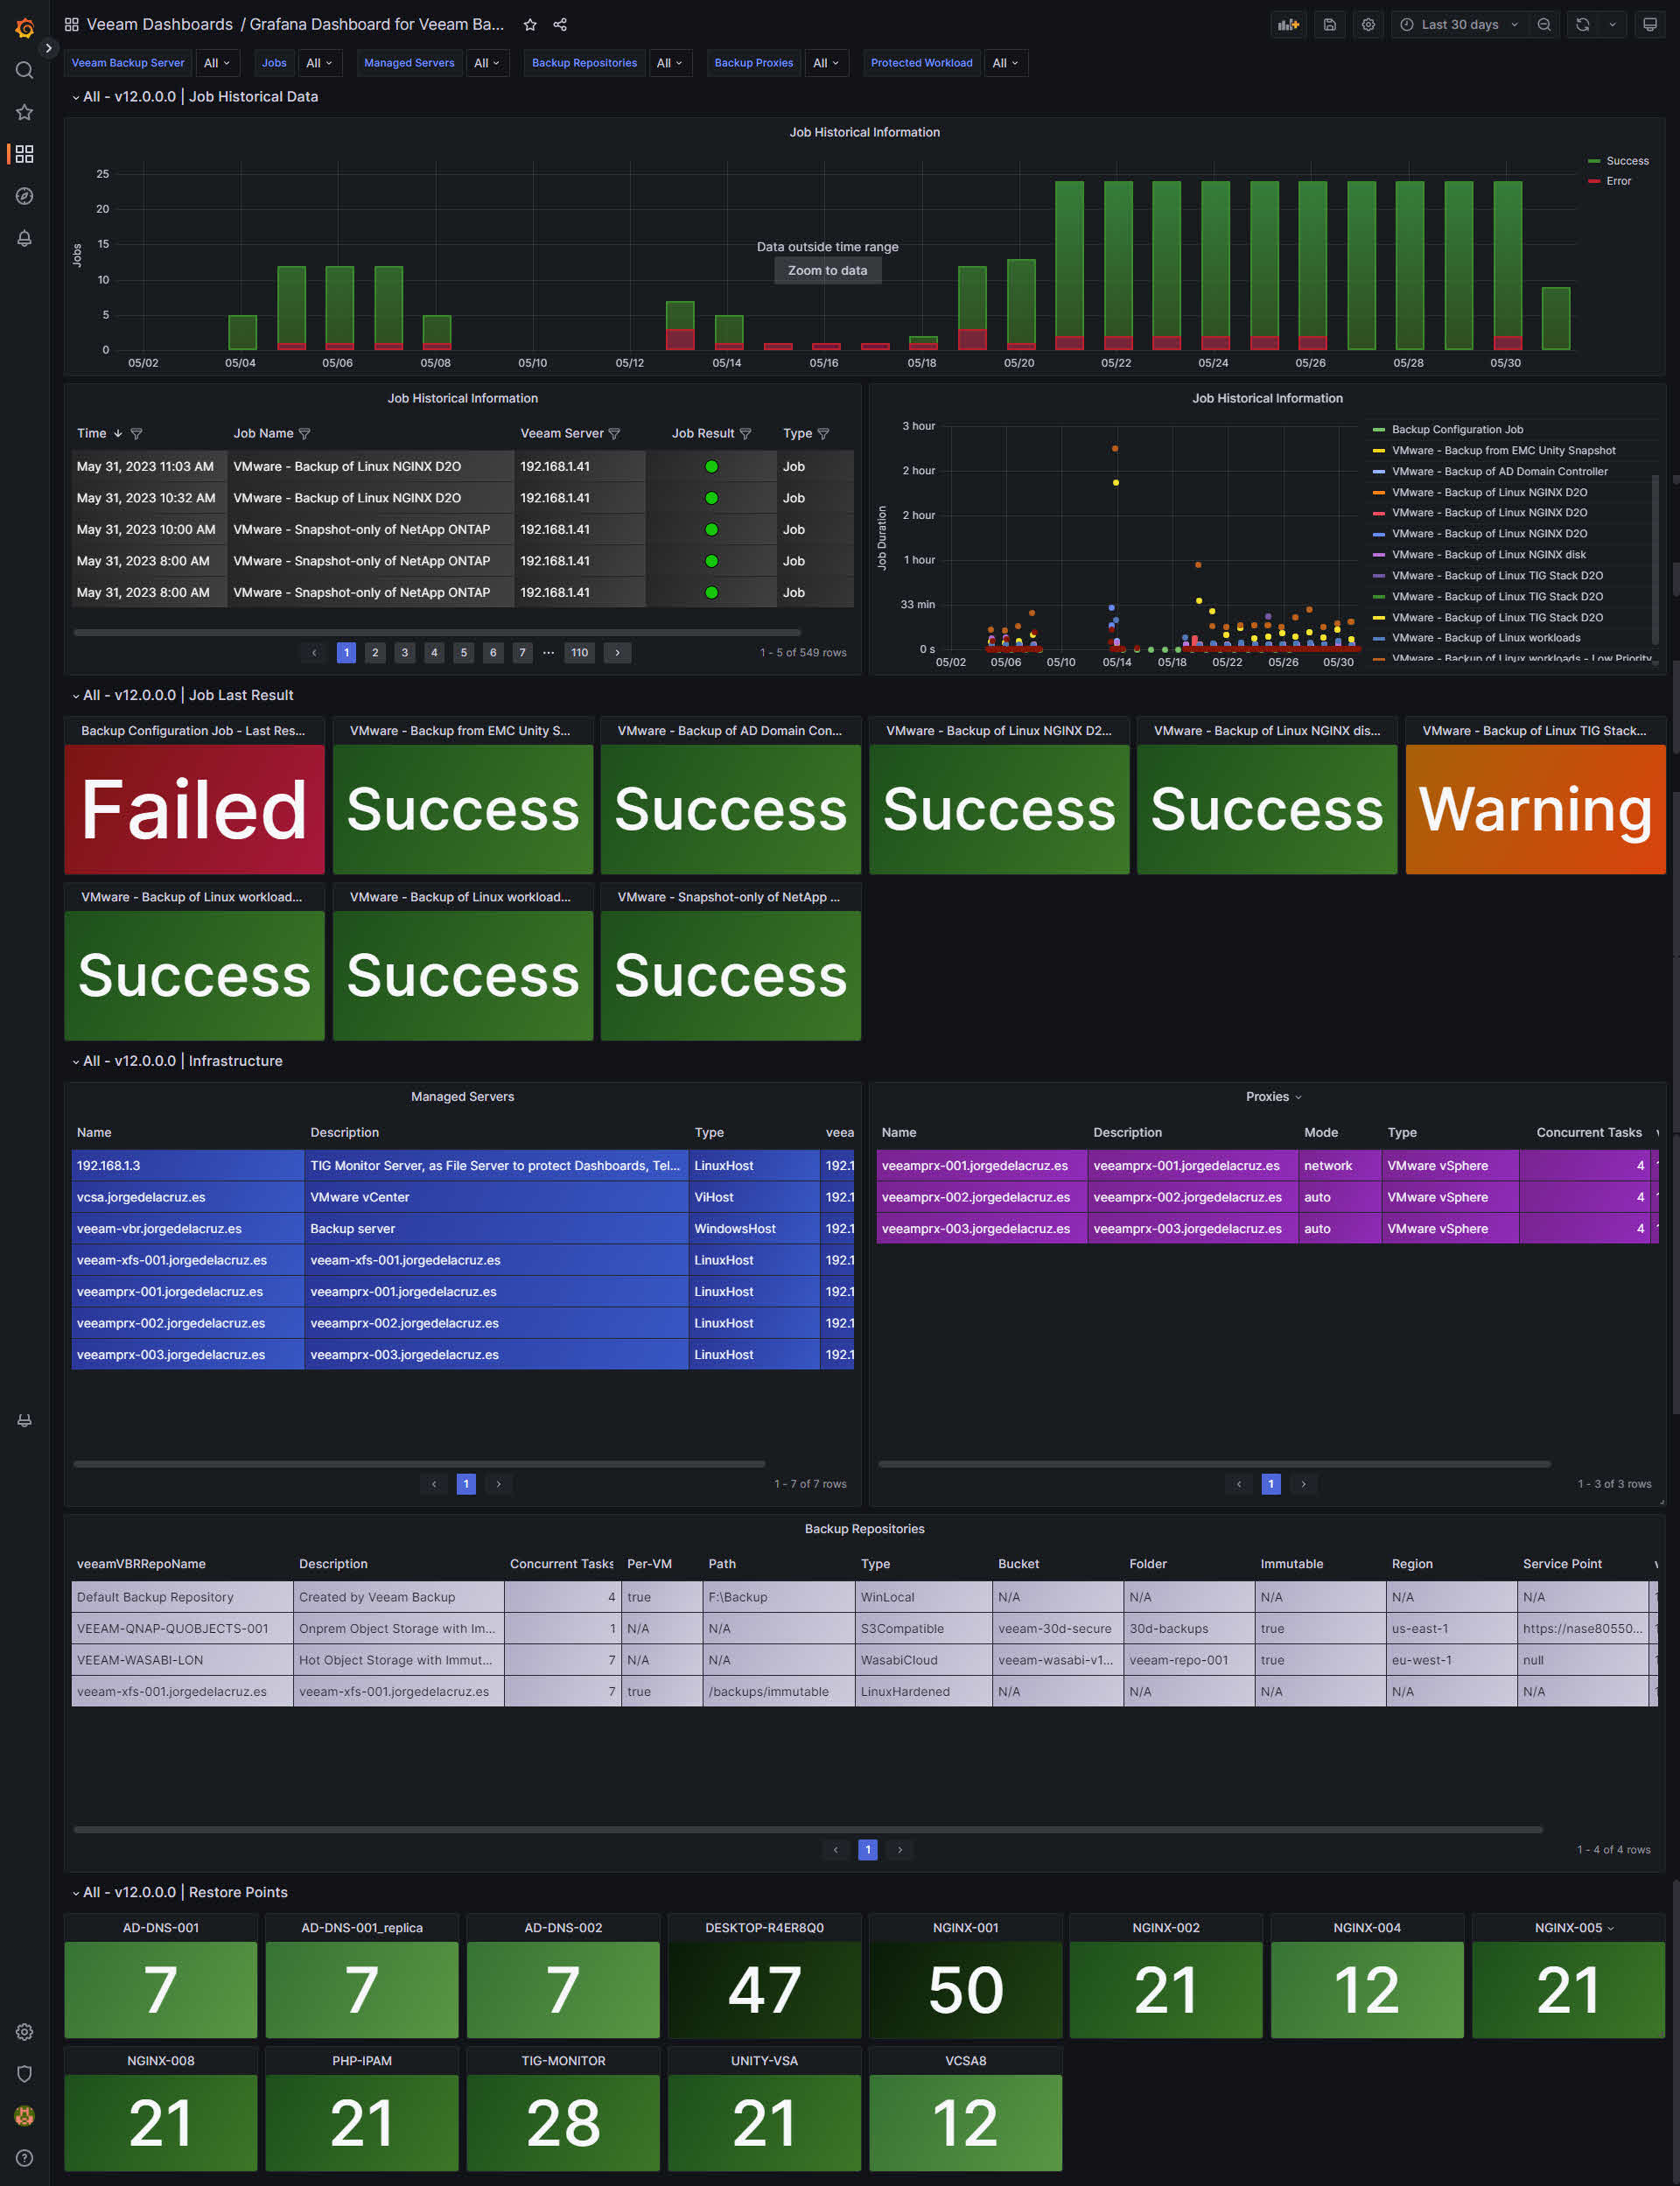
Then download or import this Dashboard to your Grafana, and you should see something similar to the next:

Data source config
Collector config:
Upload an updated version of an exported dashboard.json file from Grafana
| Revision | Description | Created | |
|---|---|---|---|
| Download |