
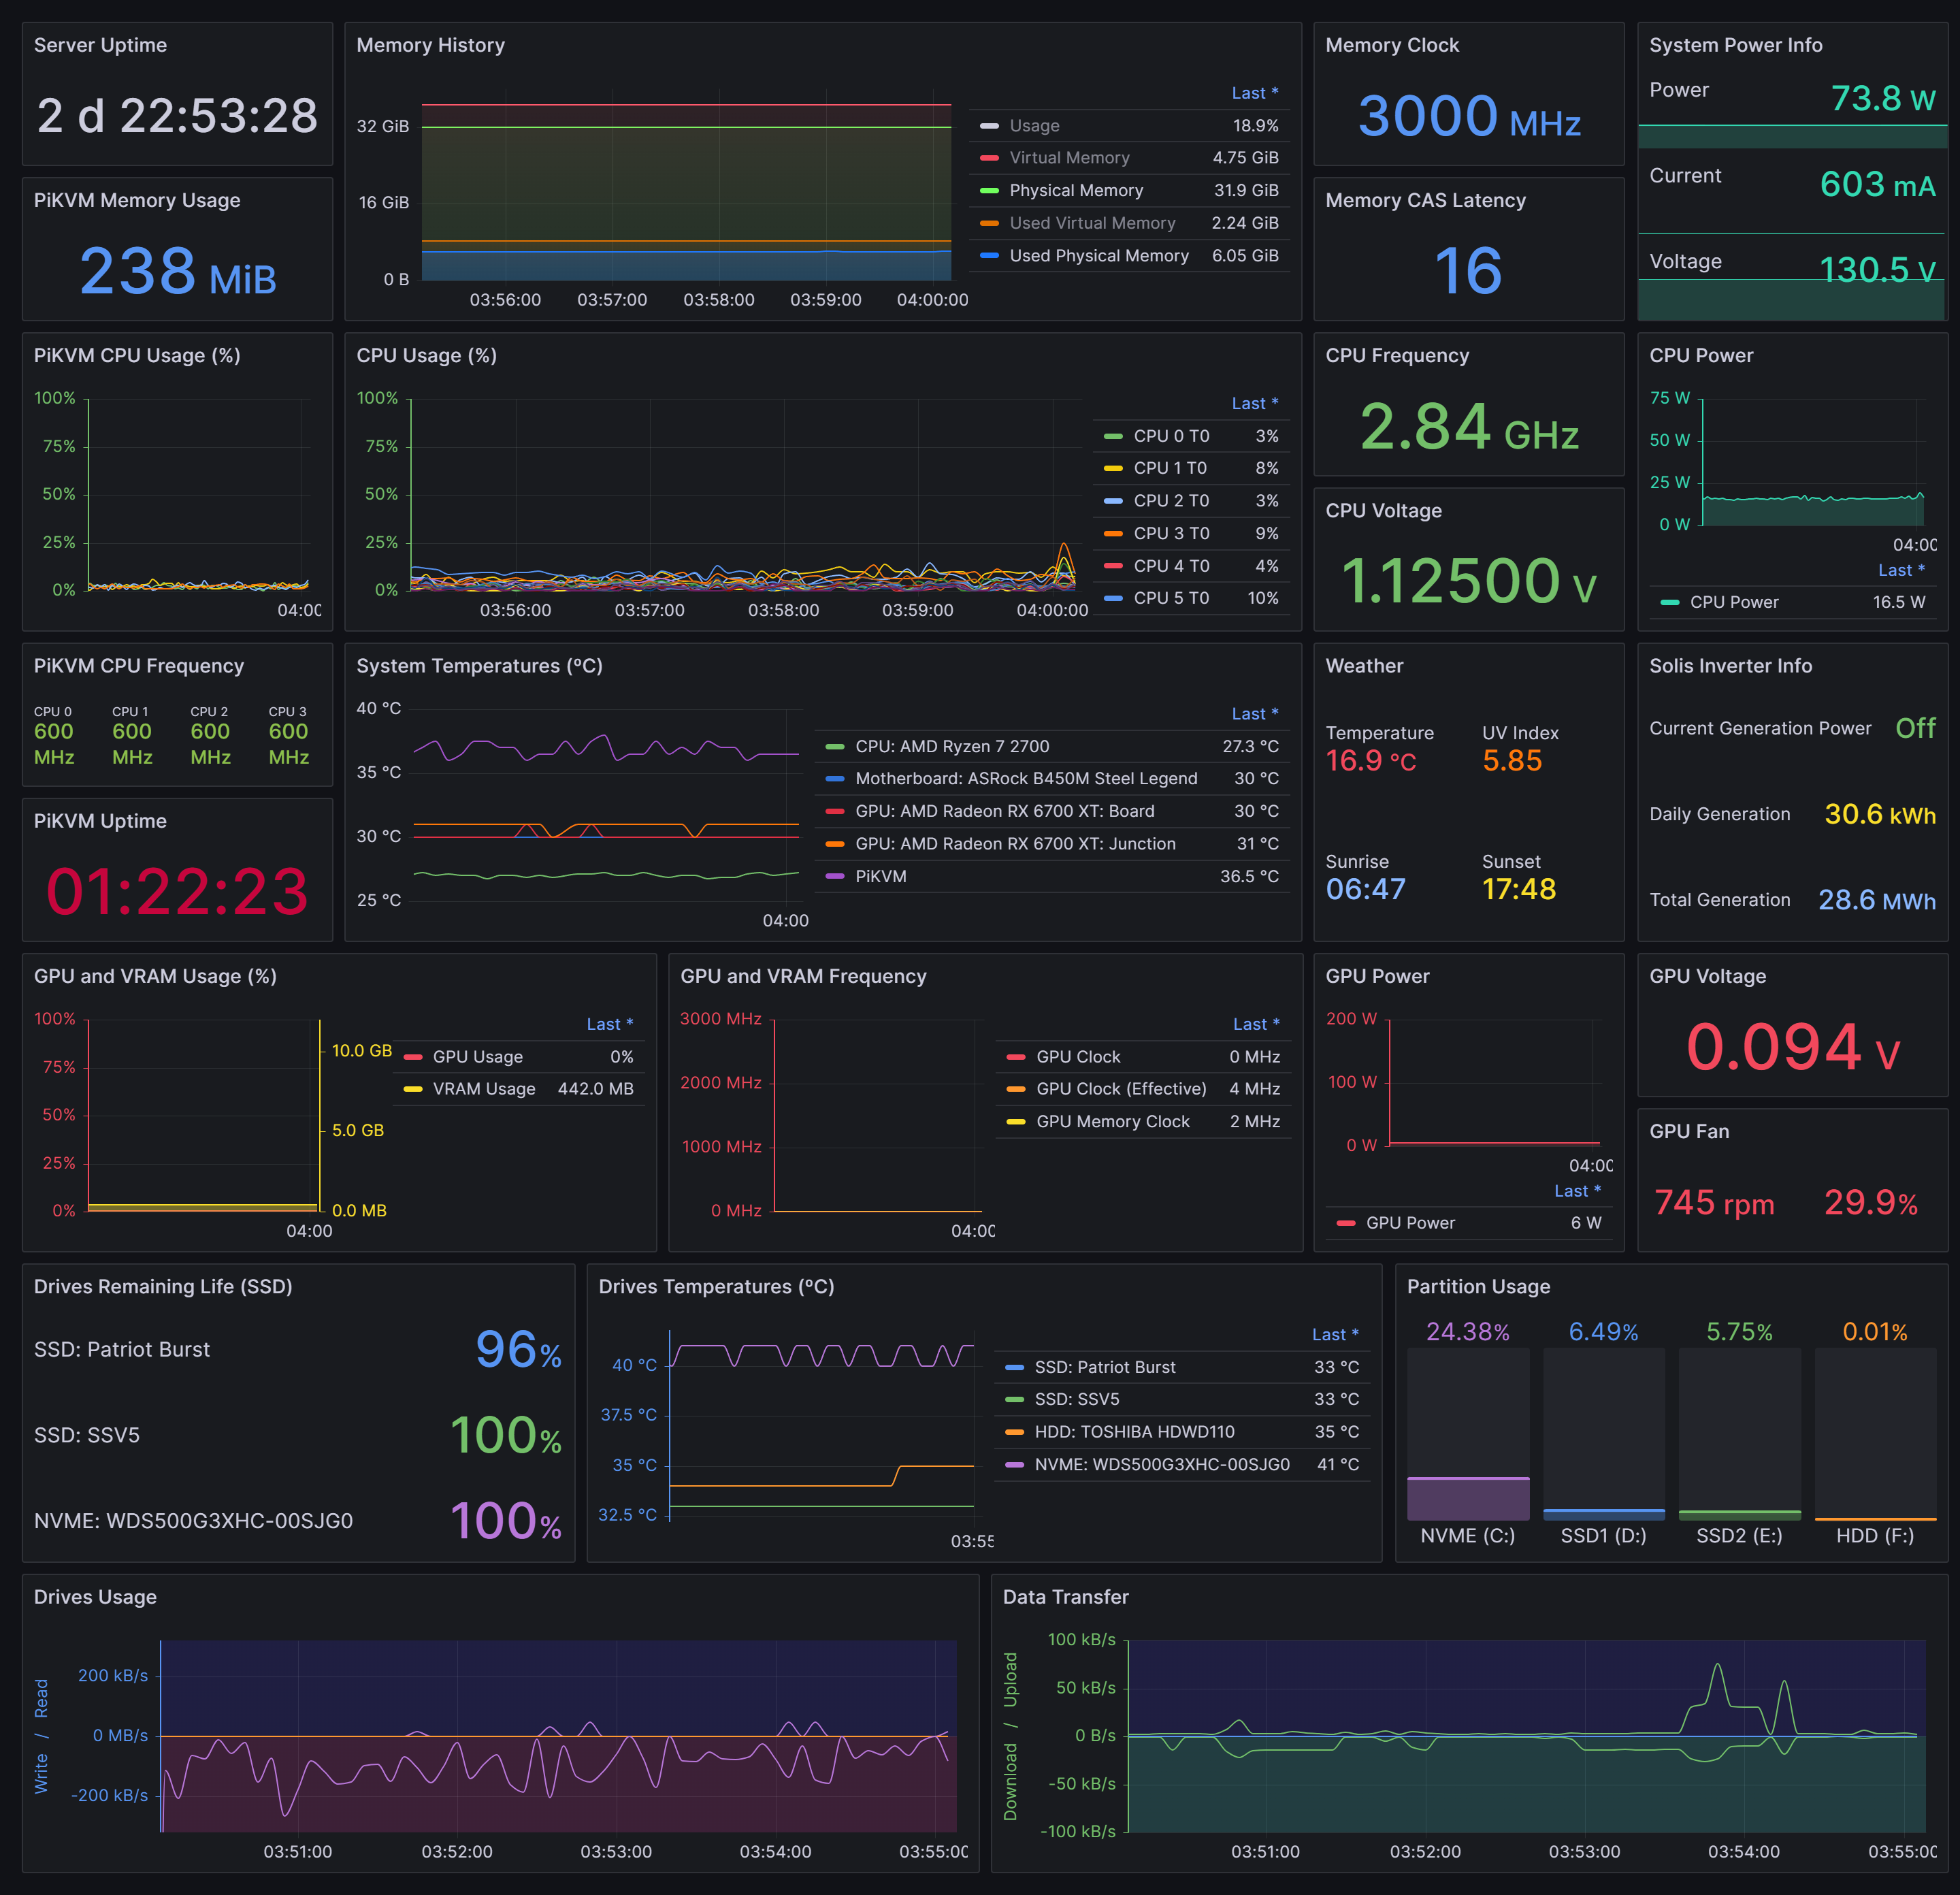
Grafana for All
Grafana Dashboard using metrics from Prometheus, Infinity, Tuya Exporter, Promdapter, Windows Exporter, Solis Inverter Exporter, Node Exporter, Open Meteo API.


Grafana for All
Grafana Dashboard using metrics from Prometheus, Infinity, Tuya Exporter, Promdapter, Windows Exporter, Solis Inverter Exporter, Node Exporter, Open Meteo API.
Dashboard Rev 10.0
What you will need:
Tuya Exporter (Smart Plug): https://github.com/rkosegi/tuya-smartplug-exporter
PromDapter (HWiNFO): https://github.com/kallex/PromDapter
Windows Exporter (Windows Info): https://github.com/prometheus-community/windows_exporter
Solis Inverter JSON API (Solis Ginlong Inverter): https://github.com/fss/solis-inverter
Node Exporter (Used on PiKVM): https://github.com/prometheus/node_exporter
Open Meteo JSON API (Weather): https://github.com/open-meteo/open-meteo
Recommended for Servers, Desktop or Personal Computer monitoring.
Dashboard on Github: https://github.com/luizbizzio/grafana-for-all/
Data source config
Collector config:
Upload an updated version of an exported dashboard.json file from Grafana
| Revision | Description | Created | |
|---|---|---|---|
| Download |
Grafana Agent
Easily monitor metrics and logs from a Grafana Agent instance with Grafana Cloud's out-of-the-box monitoring solution.
Learn more