JVM Overview (OpenTelemetry)
Dashboard for JVM metrics with OpenTelemetry instrumentation - also supports micrometer metrics
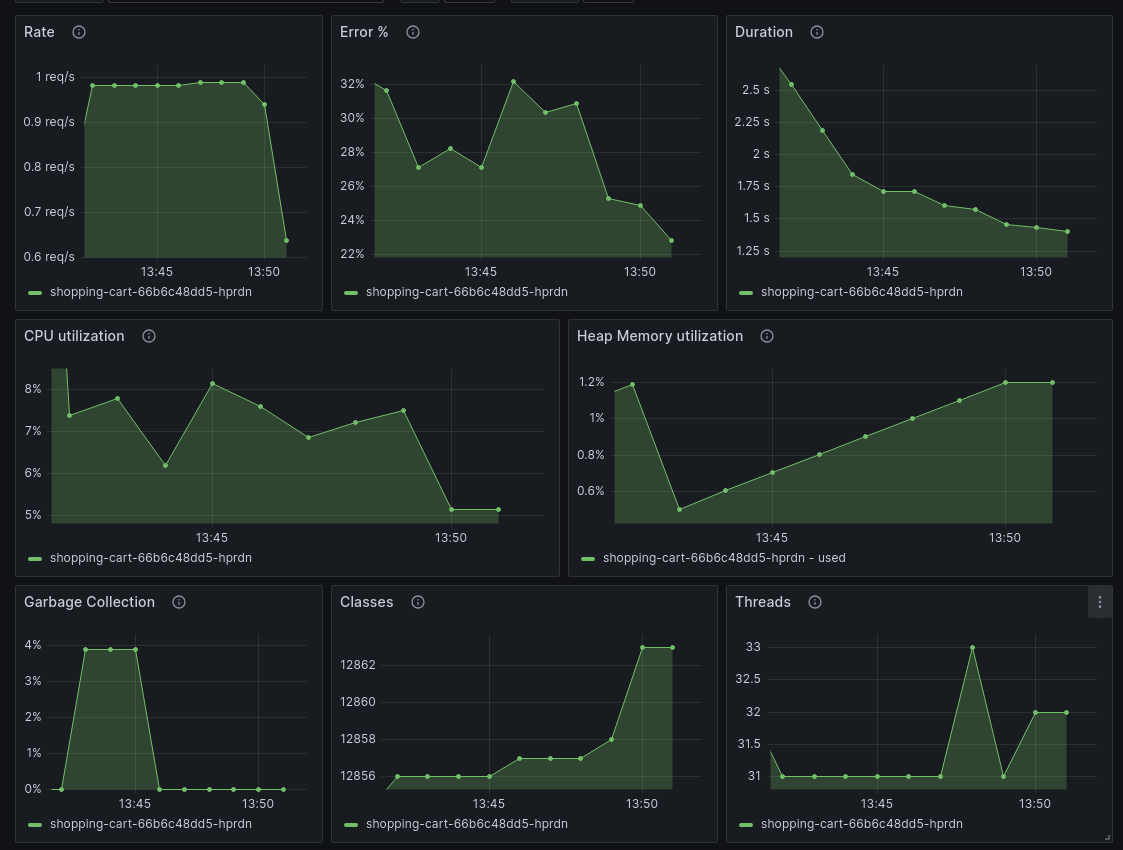
Overview for the most important JVM metrics: CPU, memory, classes, threads, and garbage collection. If you're running an HTTP server, you also get RED metrics - request rate, error ratio, and request duration.
How to send data:
- Grafana Cloud: Use "Connect Data" - search for "Java OpenTelemetry"
- Grafana OSS stack: refer to the the documentation
Data source config
Collector type:
Collector plugins:
Collector config:
Revisions
Upload an updated version of an exported dashboard.json file from Grafana
| Revision | Description | Created | |
|---|---|---|---|
| Download |
Java Virtual Machine (JVM)
Easily monitor a Java virtual machine, which allows computers to run Java programs, with Grafana Cloud's out-of-the-box monitoring solution.
Learn more