Memtierd Demo Dashboard
Dashboard used to showcase the effects of using Memtierd as a memory manager memory manager in your Kubernetes cluster.
Memtierd Demo
Showcases how Memtierd can be used as a memory manager in Kubernetes to save memory by swapping out idle processes to swap.
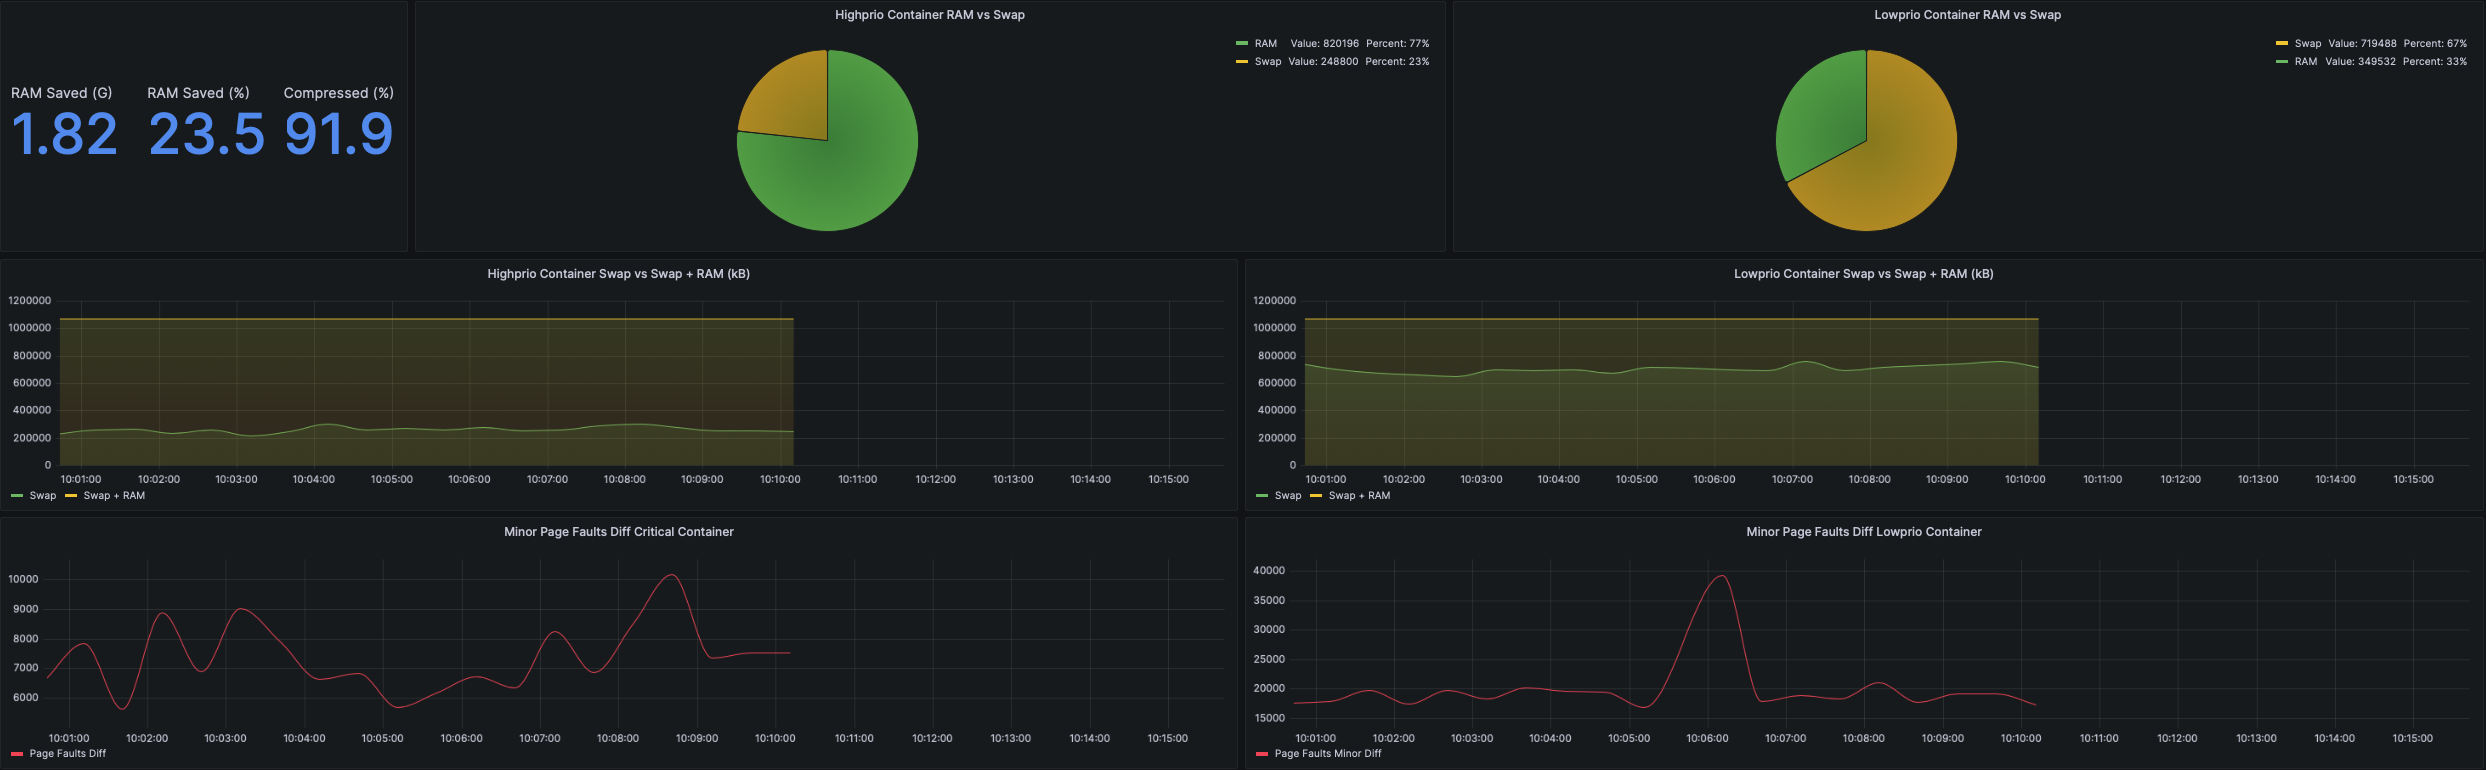
This demo showcases how "high-prio" and "low-prio" workloads behave when they are managed by Memtierd. Low-prio workloads are swapped out more aggressively than high-prio workloads.
To replicate the demo you need more than just the dashboard. The required steps can be found here.
About the metrics
RAM Saved (G)
- Tells how much RAM is being saved by swapping out the idle workloads.
RAM Saved (%)
- Tells how big the total memory saved is in comparsin to the overall memory of the system.
Compressed (%)
- Tells how well the data is being compressed.
RAM vs Swap
- Tells how the memory is being distributed between RAM and Swap.
Page faults
- Tells how many new page faults happen in between the requests from Grafana. This is a way to express the possible performance hit workloads experience if being tracked by Memtierd.
Data source config
Collector type:
Collector plugins:
Collector config:
Revisions
Upload an updated version of an exported dashboard.json file from Grafana
| Revision | Description | Created | |
|---|---|---|---|
| Download |