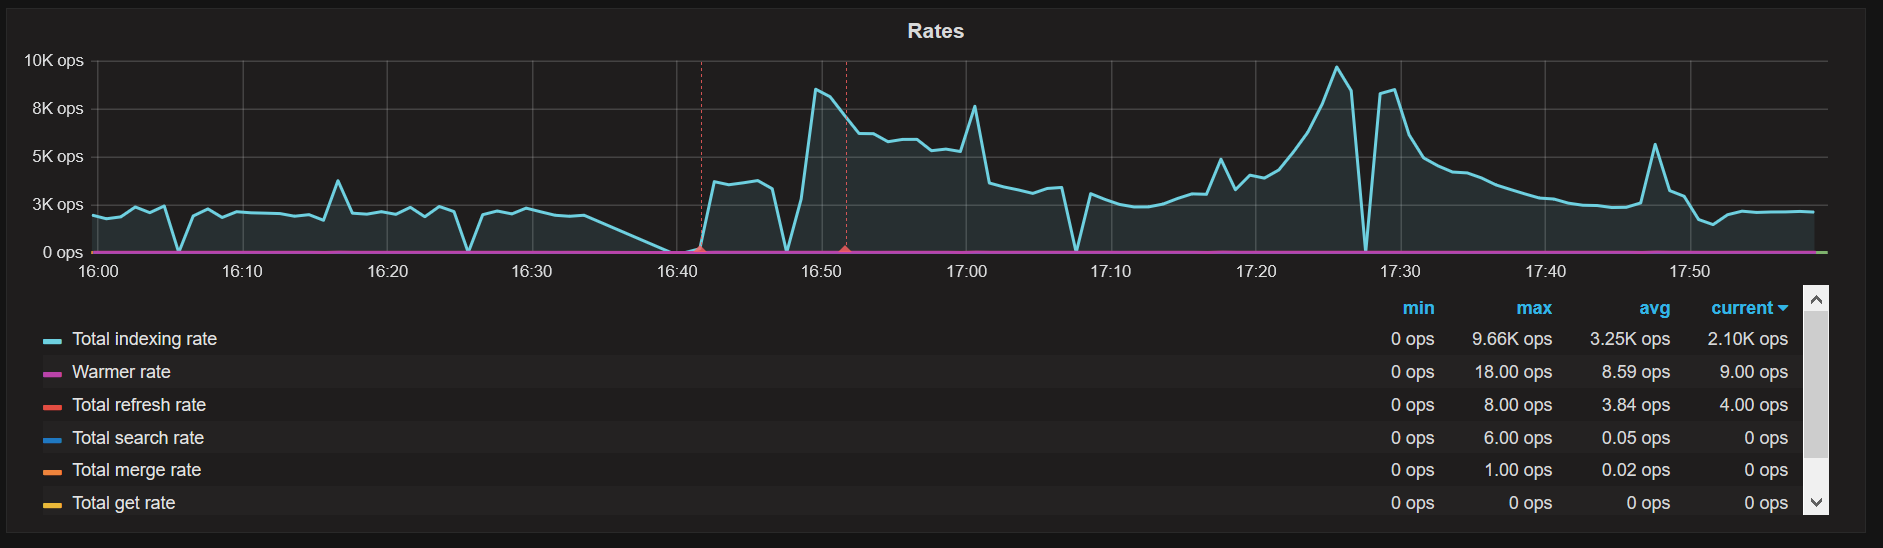
Overview Elasticsearch
Visualize status of Elasticsearch servers monitored by Zabbix
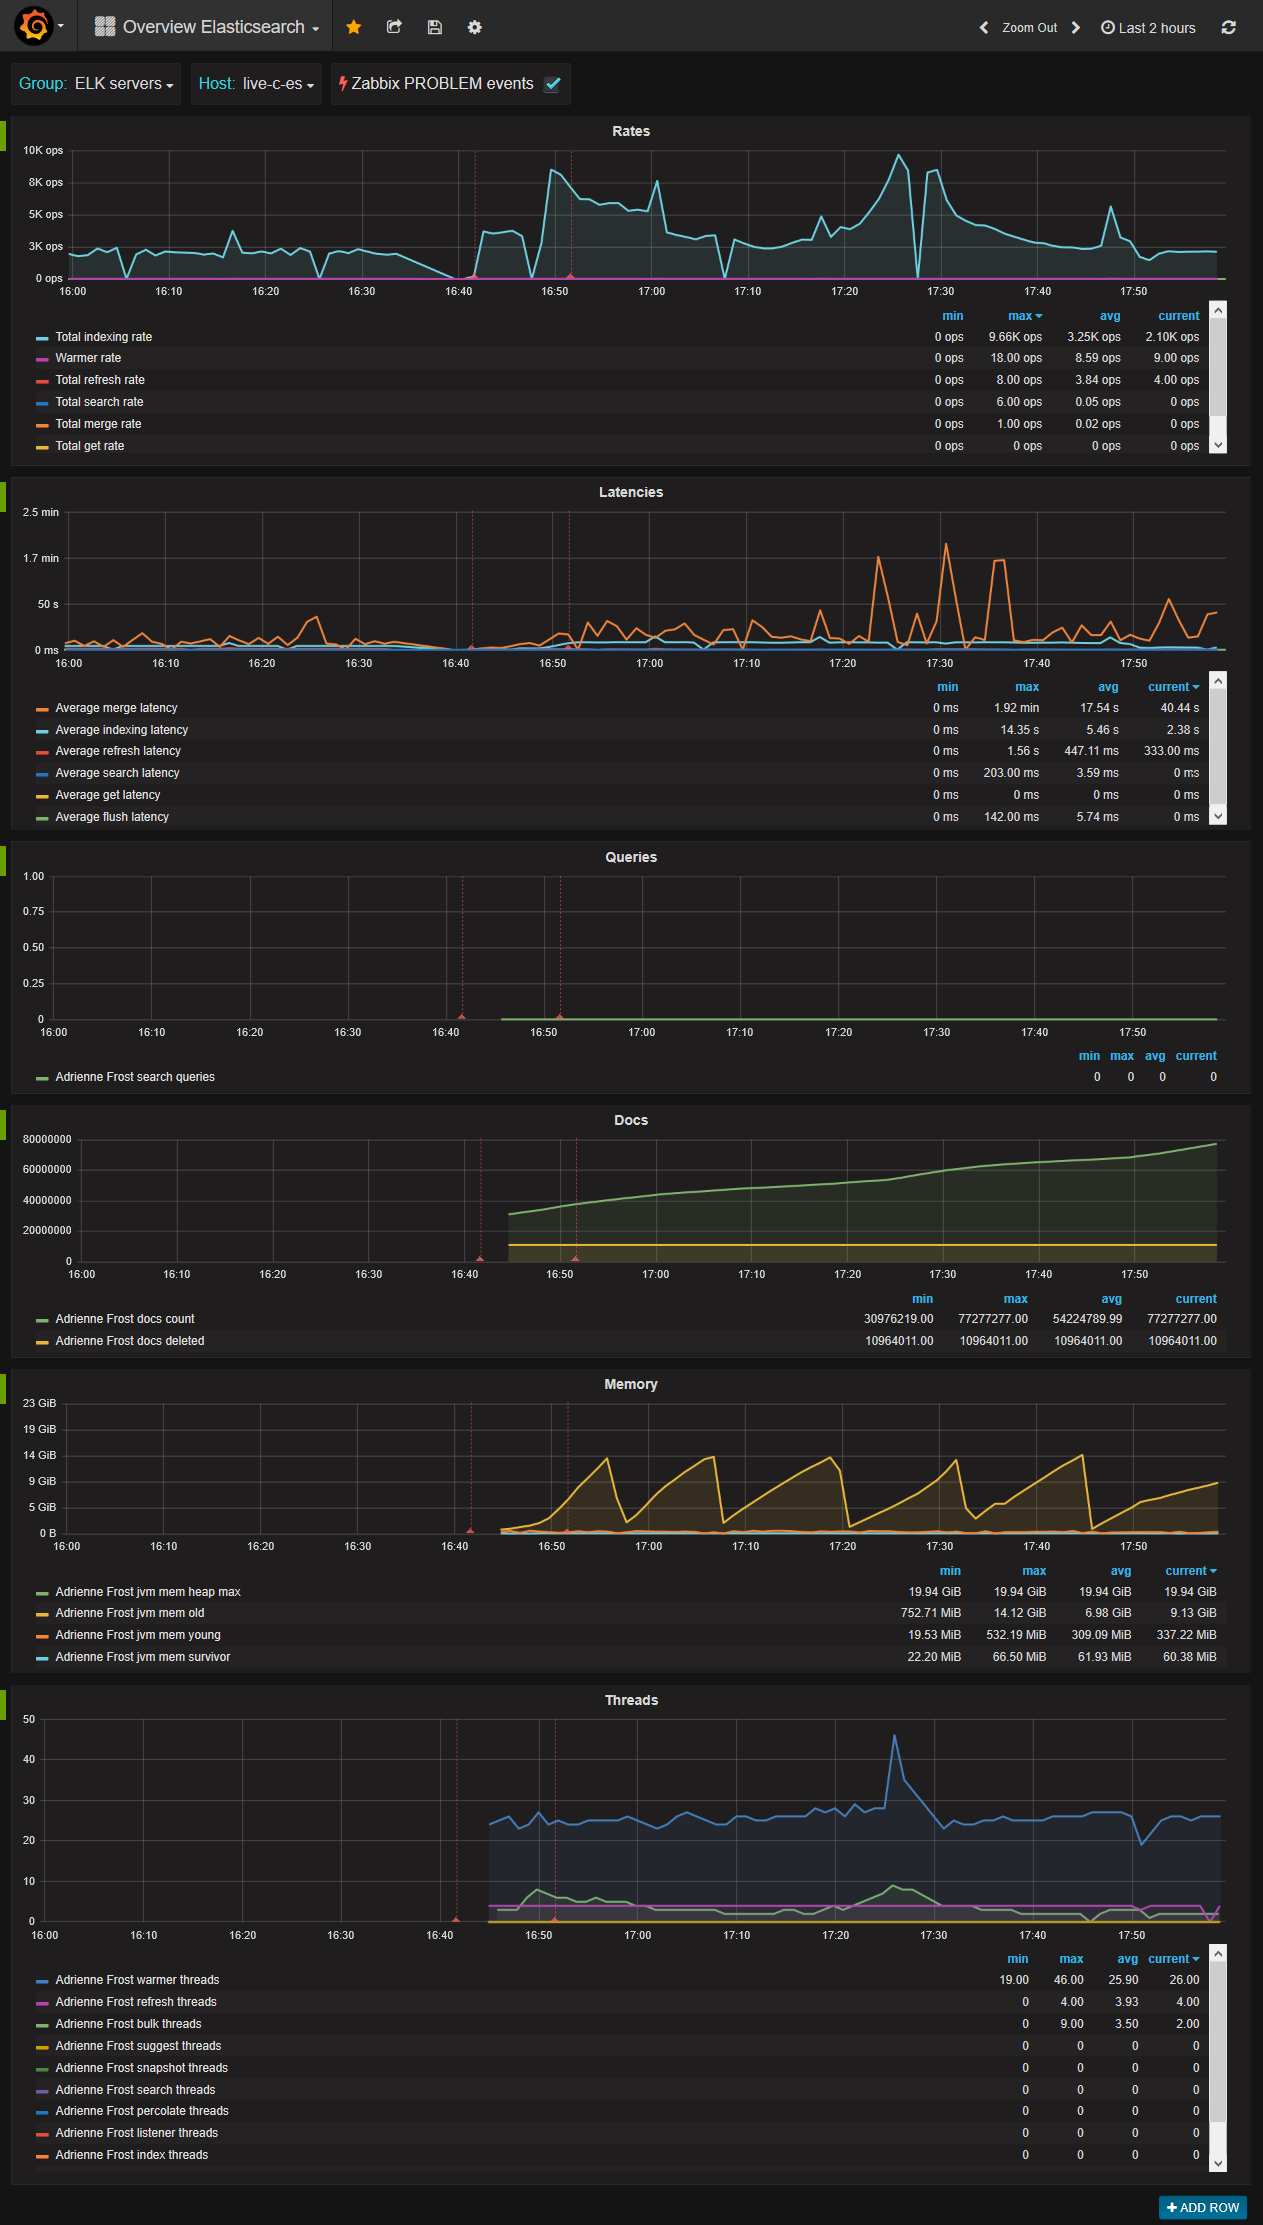
Overview Elasticsearch
Visualize status of Elasticsearch servers monitored by Zabbix.
Requirements
https://github.com/mkhpalm/elastizabbix
Zabbix datasource configuration
https://grafana.net/plugins/alexanderzobnin-zabbix-app
Make Grafana Zabbix dashboards better
Feel free to add additional Zabbix dashboards or update existing one in GitHub repo.
Commercial support for this dashboard
![]()

Data source config
Collector type:
Collector plugins:
Collector config:
Revisions
Upload an updated version of an exported dashboard.json file from Grafana
| Revision | Description | Created | |
|---|---|---|---|
| Download |
Elasticsearch
Easily monitor Elasticsearch, a distributed, multitenant full-text search engine, with Grafana Cloud's out-of-the-box monitoring solution.
Learn more