Otel - Node
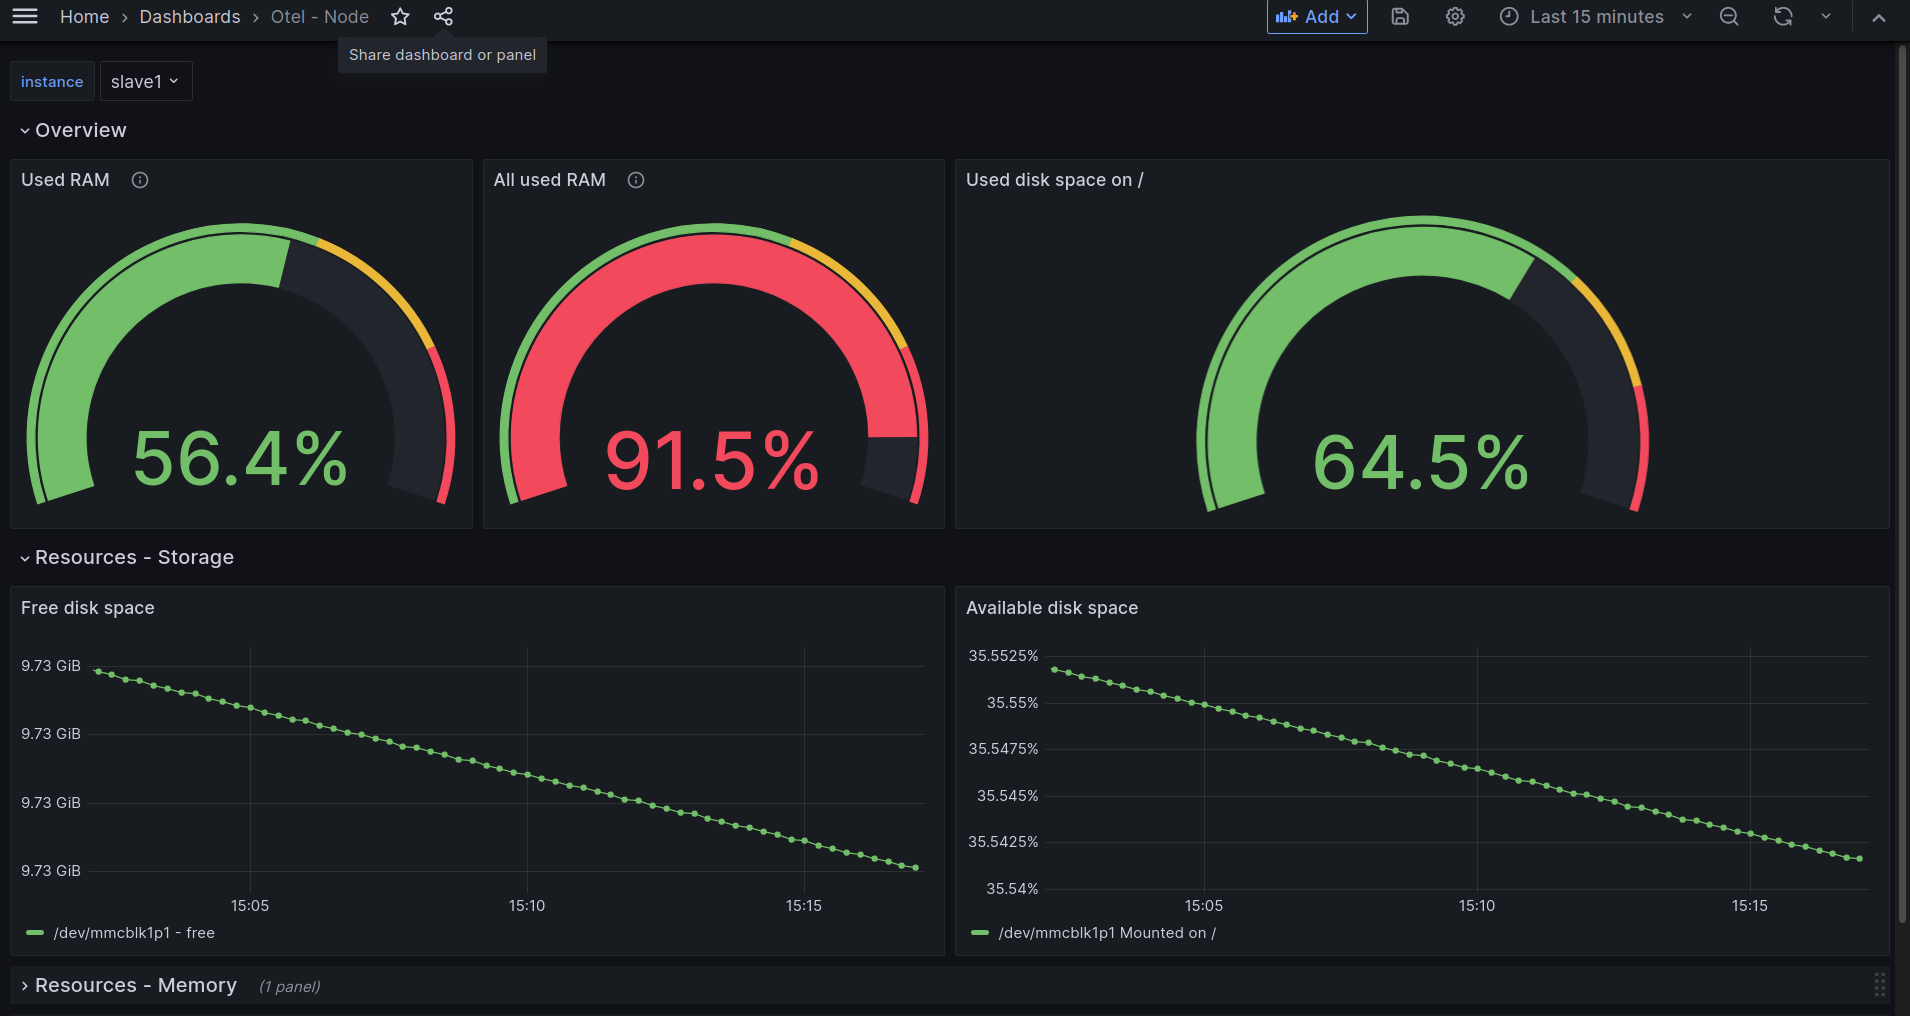
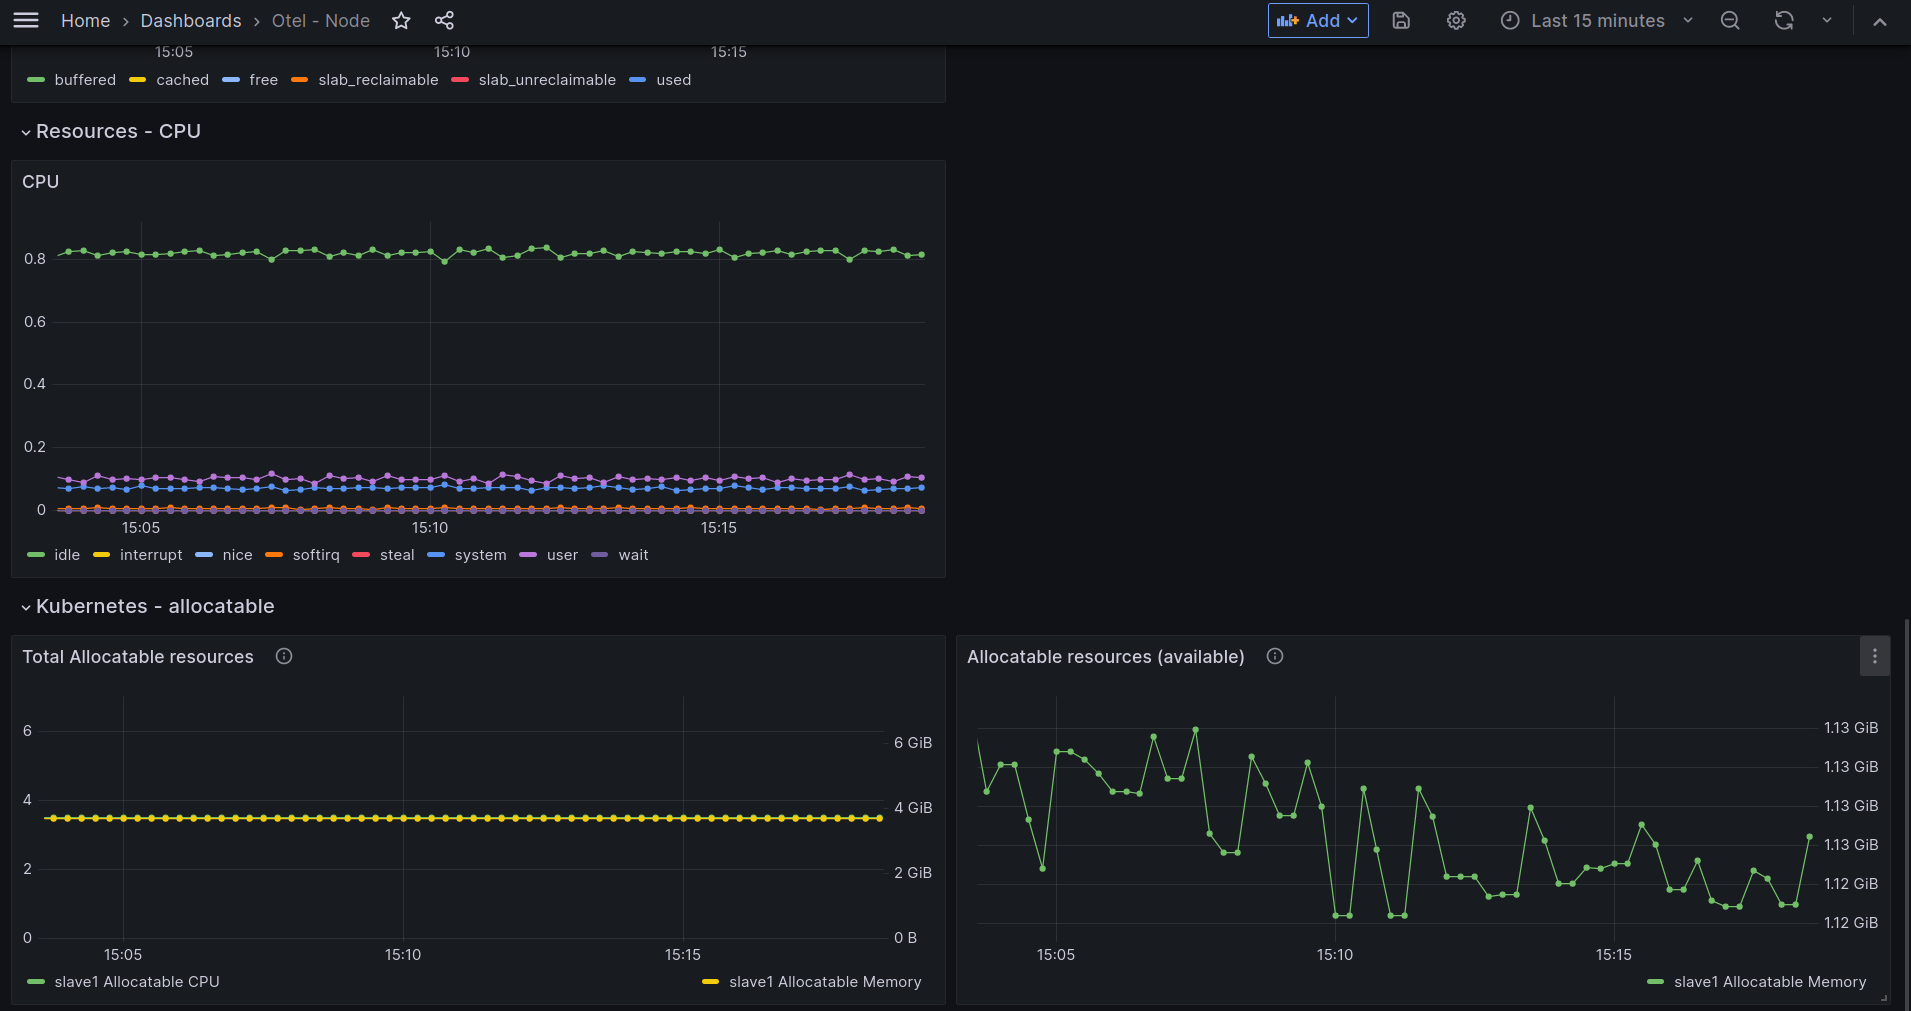
This dashboard shows important information from pods running in a kubernetes cluster. It relies on metrics collected using Otel's Kubelet Stats receiver and Otel's Kubernetes cluster receiver. The following snippet shows an OpenTelemetry collector's configuration that should scrape the metrics required by this dashboard:
receivers:
  hostmetrics:
    collection_interval: 10s
    root_path: /hostfs
    scrapers:
      cpu:
        metrics:
          system.cpu.utilization:
            enabled: true
      disk: null
      filesystem:
        exclude_fs_types:
          fs_types:
          - autofs
          - binfmt_misc
          - bpf
          - cgroup2
          - configfs
          - debugfs
          - devpts
          - devtmpfs
          - fusectl
          - hugetlbfs
          - iso9660
          - mqueue
          - nsfs
          - overlay
          - proc
          - procfs
          - pstore
          - rpc_pipefs
          - securityfs
          - selinuxfs
          - squashfs
          - sysfs
          - tracefs
          match_type: strict
        exclude_mount_points:
          match_type: regexp
          mount_points:
          - /dev/*
          - /proc/*
          - /sys/*
          - /run/k3s/containerd/*
          - /var/lib/docker/*
          - /var/lib/kubelet/*
          - /snap/*
        metrics:
          system.filesystem.utilization:
            enabled: true
      load: null
      memory:
        metrics:
          system.memory.utilization:
            enabled: true
      network: null
  k8s_cluster:
    allocatable_types_to_report:
    - cpu
    - memory
    - storage
    - ephemeral-storage
    collection_interval: 15s
    node_conditions_to_report:
    - Ready
    - MemoryPressure
processors:
  resourcedetection/env:
    detectors:
    - env
  resource/remove_pod_name:
    attributes:
    - action: delete
      key: k8s.pod.name
    - action: delete
      key: k8s_pod_name
  resource/remove_container_id:
    attributes:
    - action: delete
      key: container.id
    - action: delete
      key: container_id
exporters:
  prometheusremotewrite/local:
    endpoint: http://prometheus-server/api/v1/write
    resource_to_telemetry_conversion:
      enabled: true
service:
  extensions:
  - health_check
  - memory_ballast
  pipelines
    metrics/hostmetrics:
      exporters:
      - prometheusremotewrite/local
      processors:
      - resourcedetection/env
      - resource/remove_pod_name
      receivers:
      - hostmetrics
    metrics/k8s_cluster:
      exporters:
      - prometheusremotewrite/local
      processors:
      - resource/remove_container_id
      receivers:
      - k8s_cluster
A few things from that config snippet should be explained further:
- container_id label is removed from metrics (metrics/k8s_cluster pipeline). The biggest reason why this is done is because, when containers get restarted, they will create a new time series (because container_id labe is different). This demands more resources from prometheus and would break some panels (like rate(containers_restart))
- prometheusremotewrite exporter enables resource_to_telemetry_conversion is required to export existing attributes as prometheus labels.
- k8s_pod_name label is removed from the metrics/hostmetrics pipeline because, if the otel pod from a node (this was deployed using a daemonset) is recreated (for example, when updating otel's helm chart) a new time series would be created for the same node
- Resource Detection processor is used with env vars sample setup can be found here to add required attributes to hostmetrics resources (that will later on be translated into prometheus labels).
Data source config
Collector type:
Collector plugins:
Collector config:
Revisions
Upload an updated version of an exported dashboard.json file from Grafana
| Revision | Description | Created | |
|---|---|---|---|
| Download |
Linux Server
Monitor Linux with Grafana. Easily monitor your Linux deployment with Grafana Cloud's out-of-the-box monitoring solution.
Learn more