Uptime Kuma - SLA/Latency/Certs
A dashboard to visualize the metrics from HTTP endpoints in [Uptime Kuma](https://github.com/louislam/uptime-kuma) Improved by https://github.com/EliottGoye
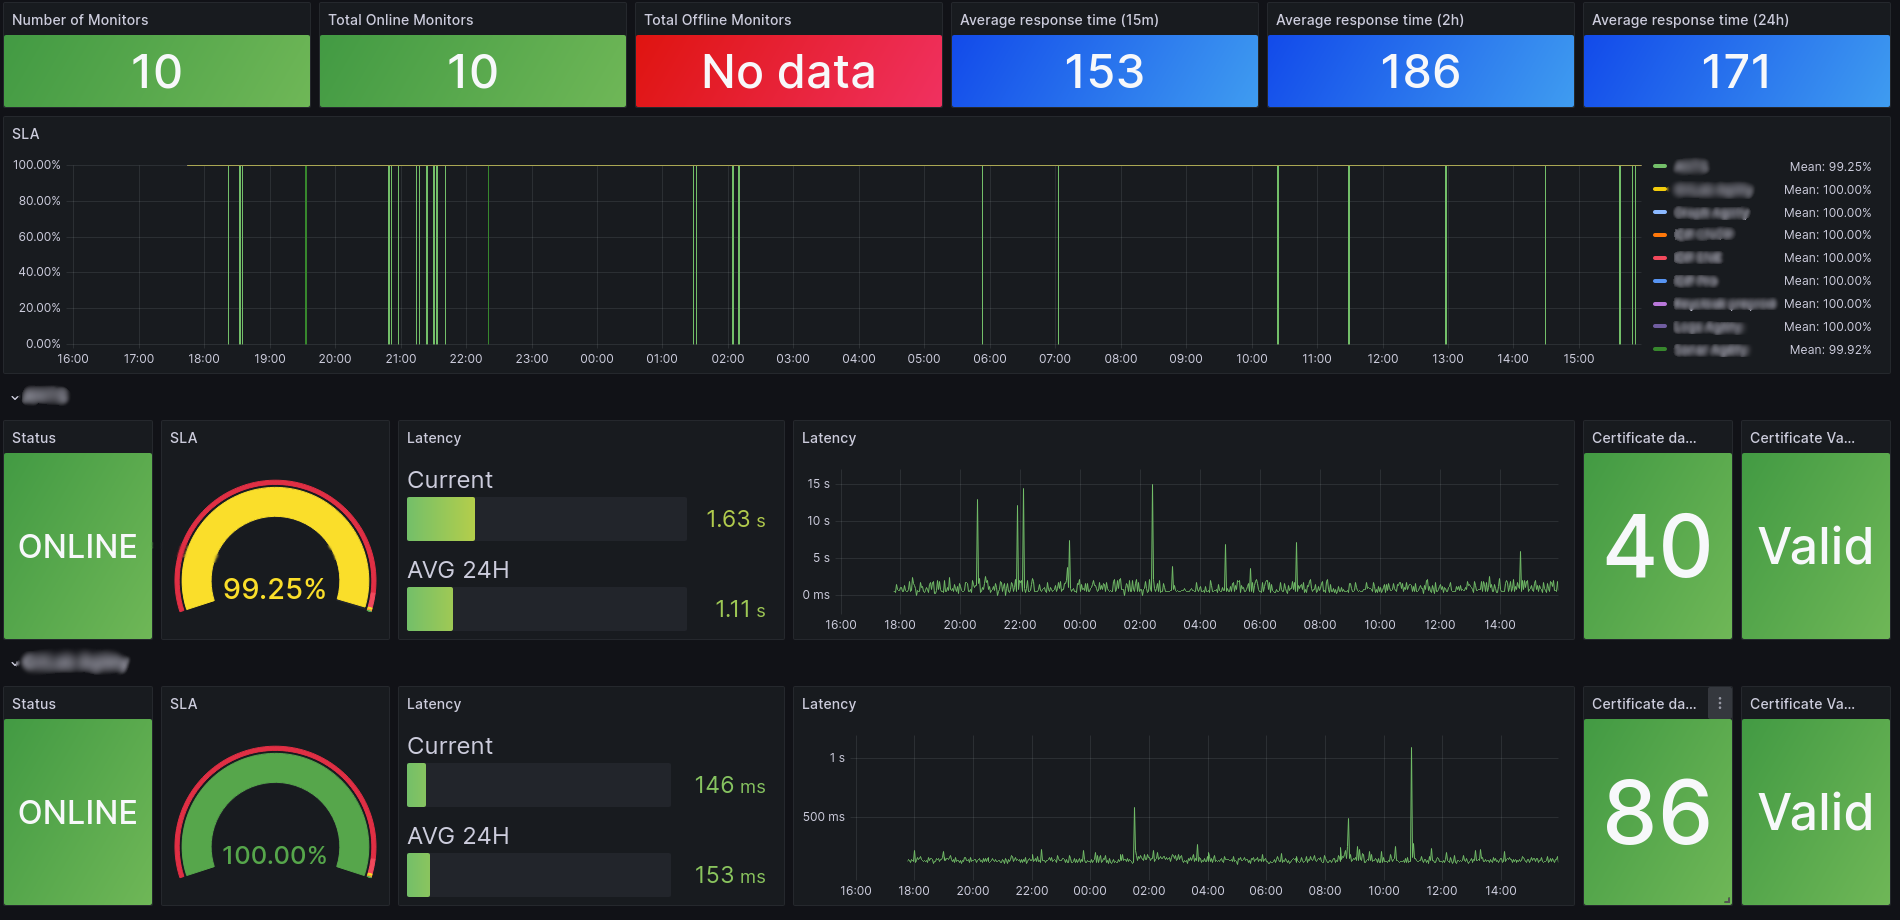
The Uptime Kuma - SLA/Latency/Certs dashboard uses the prometheus data source to create a Grafana dashboard with the bargauge, gauge, stat and timeseries panels.
Data source config
Collector type:
Collector plugins:
Collector config:
Revisions
Upload an updated version of an exported dashboard.json file from Grafana
| Revision | Description | Created | |
|---|---|---|---|
| Download |