Geth node monitor
Geth node metrics monitoring, the process of tracking and analyzing various performance metrics of a Geth node
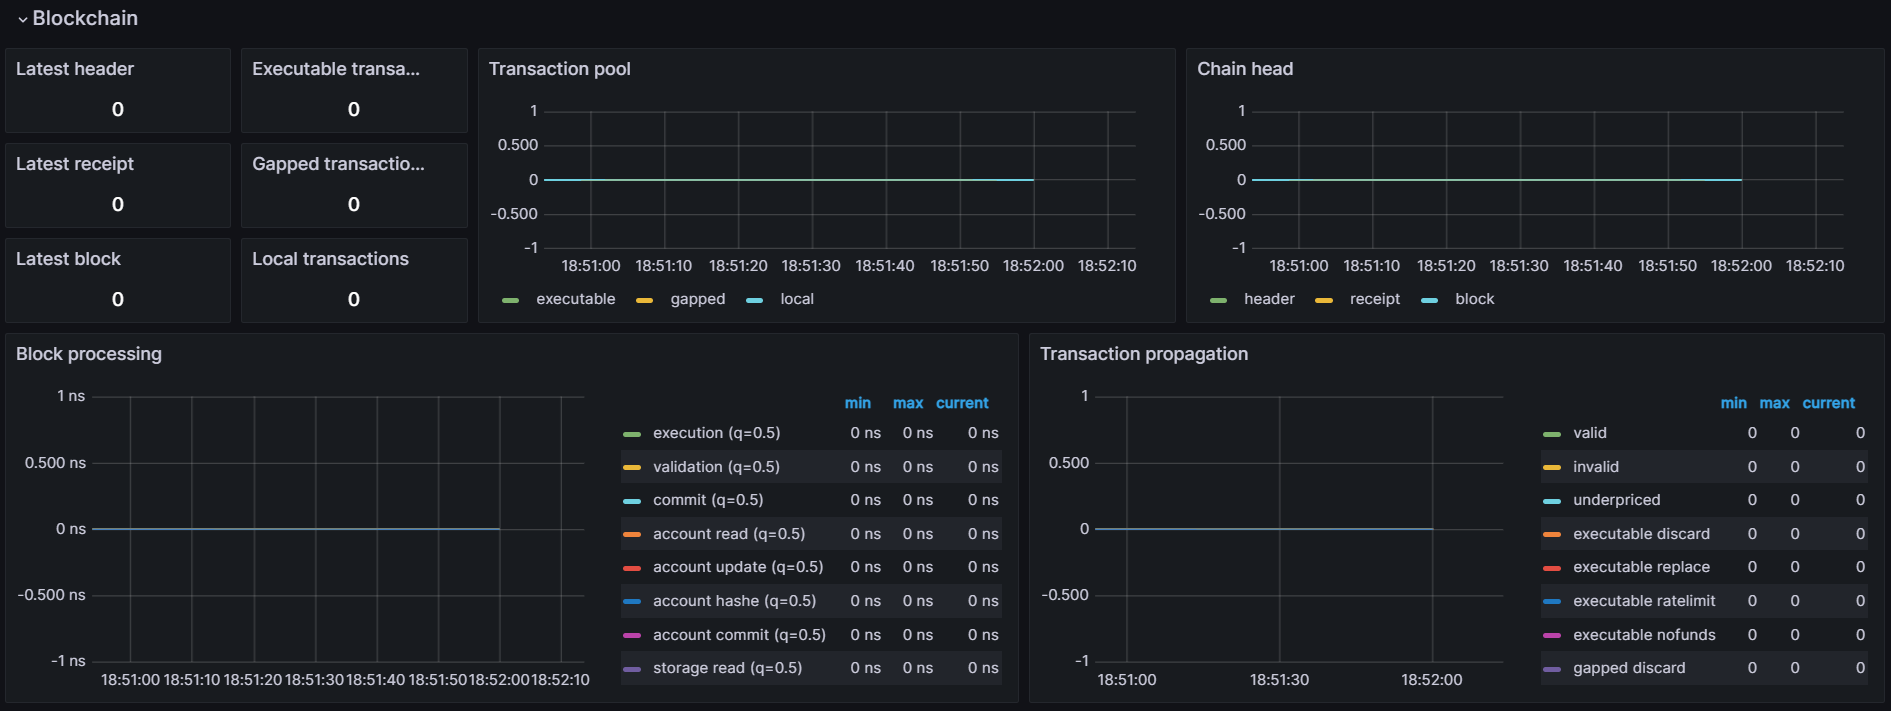
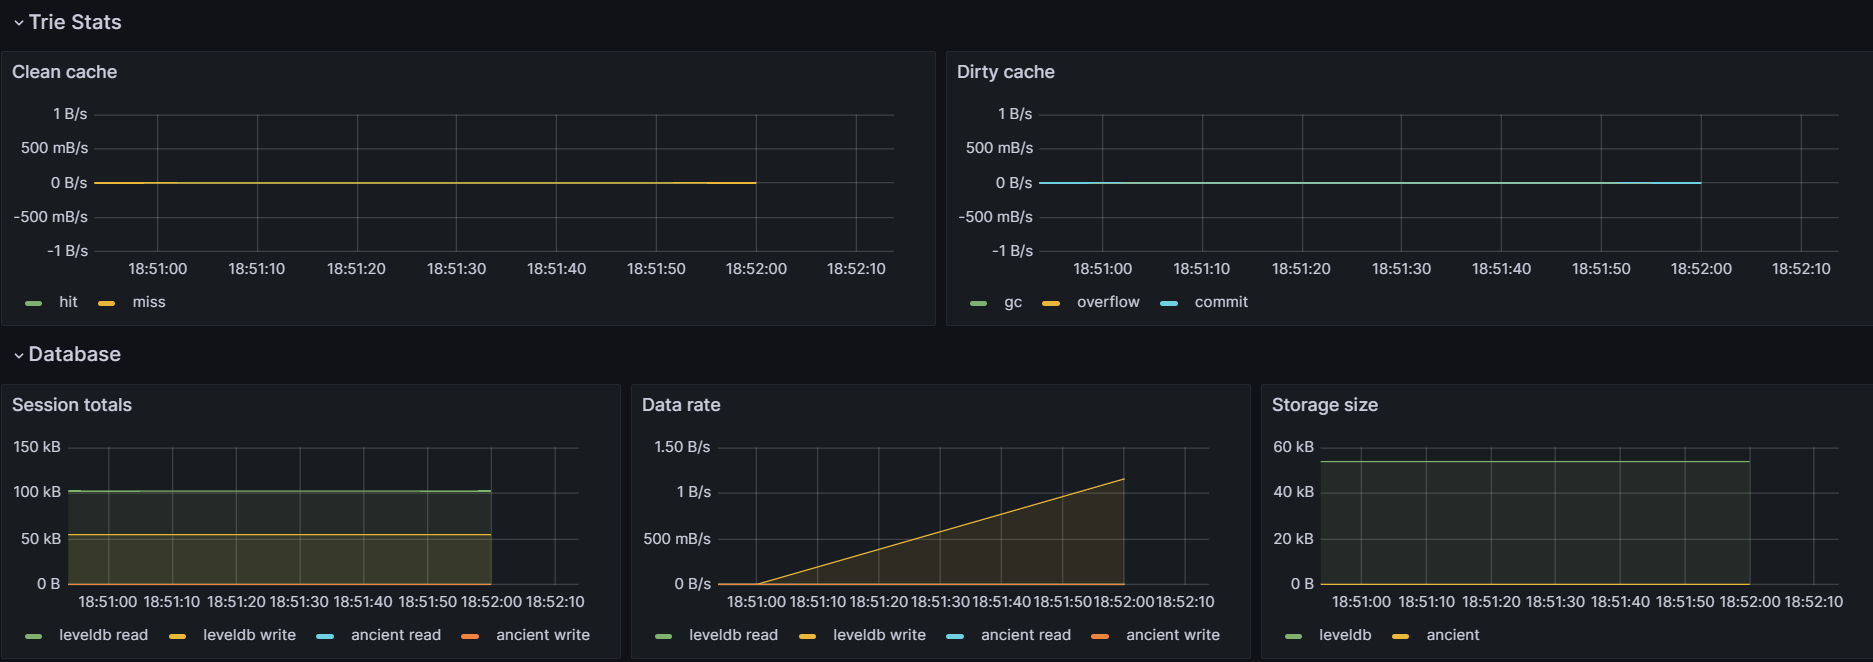
This is a dashboard that visualizes the metrics data provided by Go-Ethereum (Geth) through its Prometheus endpoint. It allows for thorough monitoring of Geth metrics data with the help of Prometheus and Grafana.
You need to mentioned the job in prometheus.yml file as:
scrape_configs:
  - job_name: "geth"
    scrape_interval: "15s"
    static_configs:
      - targets: ["localhost:6060"]
    metrics_path: "/debug/metrics"
localhost:6060/debug/metrics is endpoint where prometheus metrics are exposed
Data source config
Collector type:
Collector plugins:
Collector config:
Revisions
Upload an updated version of an exported dashboard.json file from Grafana
| Revision | Description | Created | |
|---|---|---|---|
| Download |
Linux Server
Monitor Linux with Grafana. Easily monitor your Linux deployment with Grafana Cloud's out-of-the-box monitoring solution.
Learn more