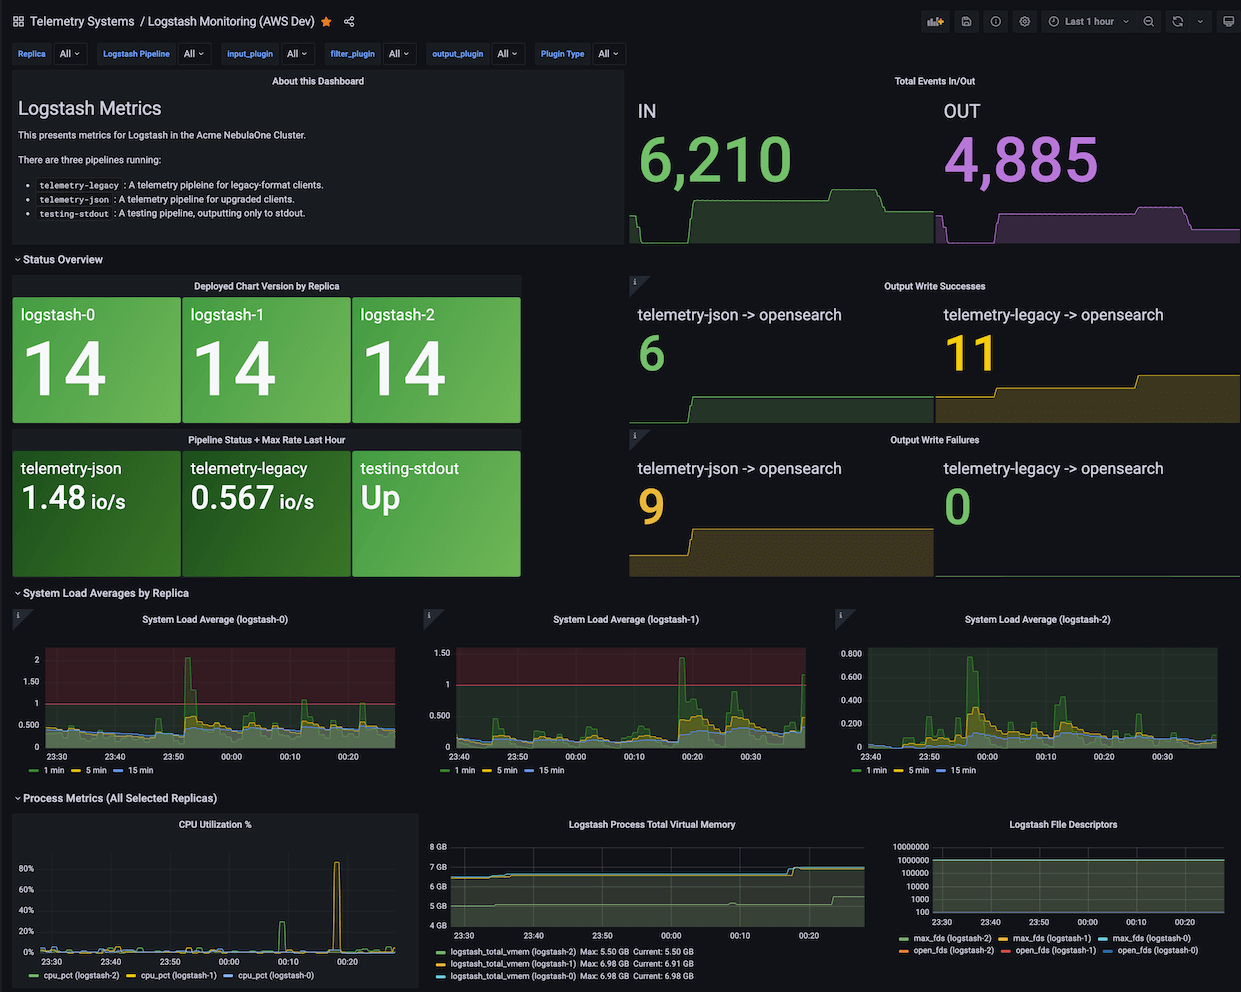
Logstash on Kubernetes Dashboard
Logstash Health Monitoring: System, JVM, Pipeline and individual plugin stats for Logstash replicas running on Kubernetes.
Logstash on Kubernetes Dashboard
A Grafana Dashboard for https://github.com/kuskoman/logstash-exporter.
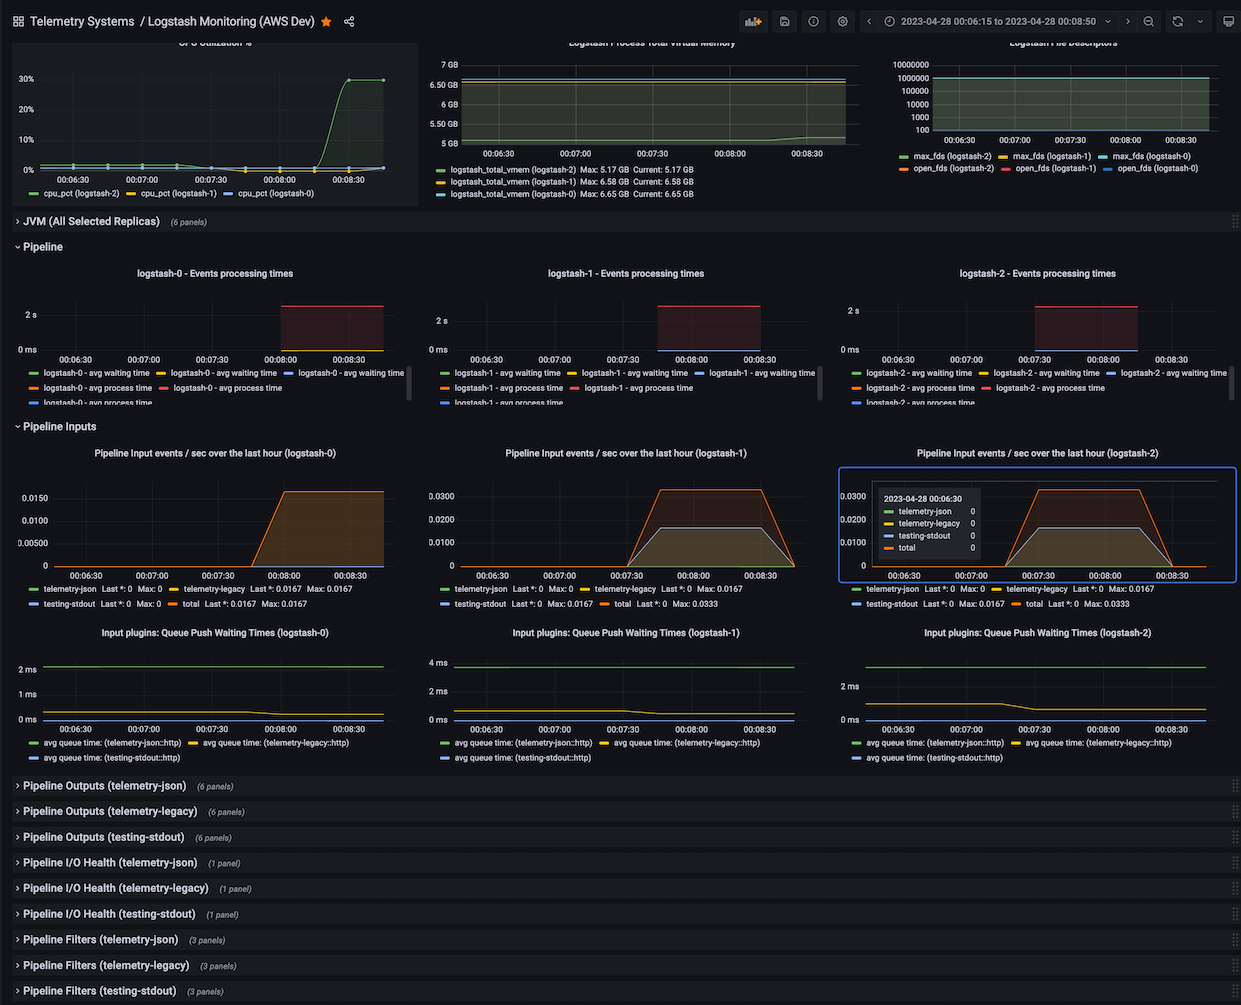
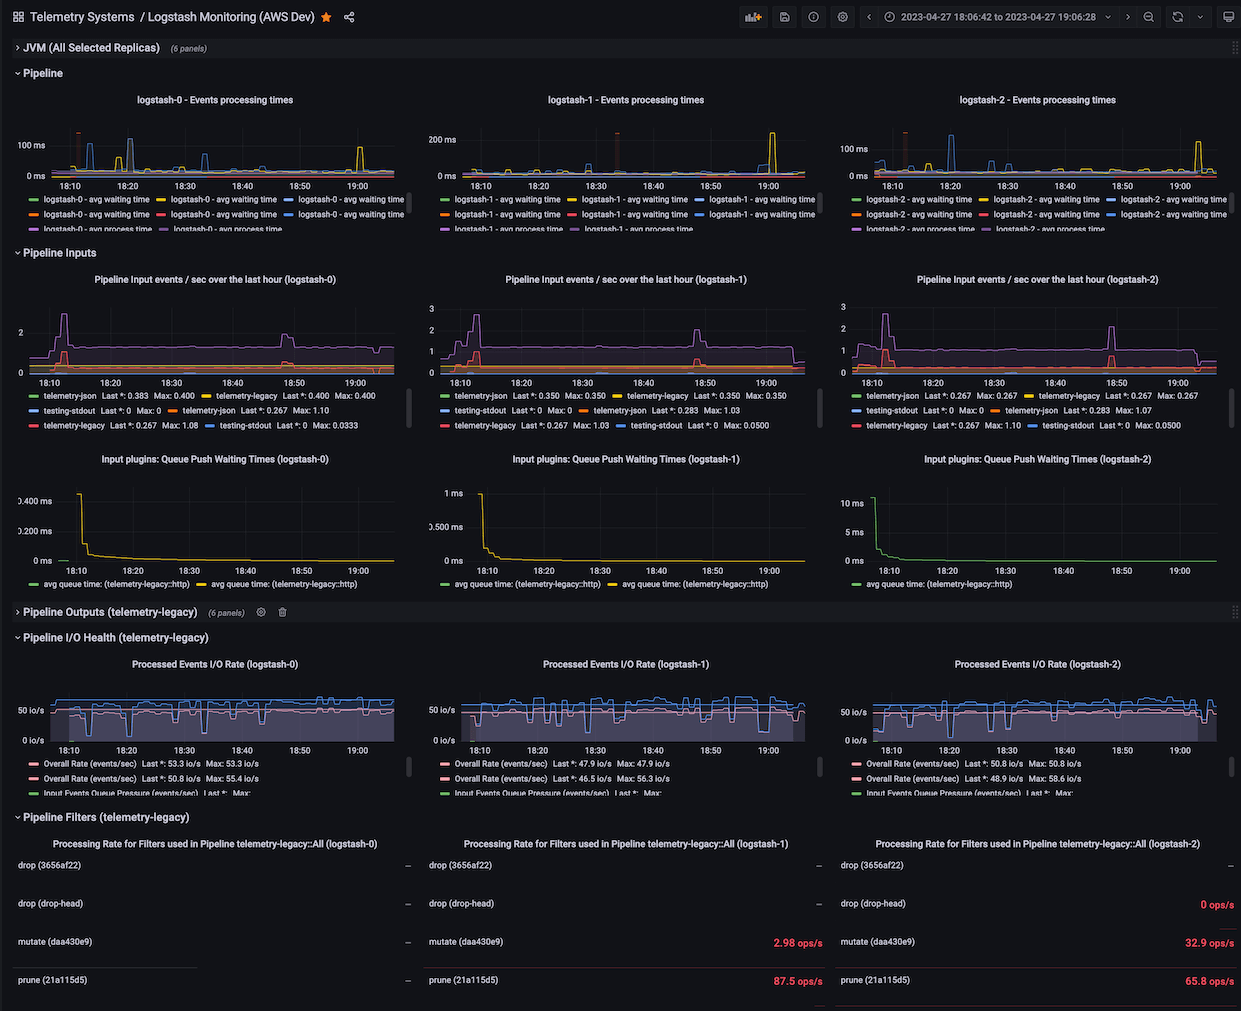
Monitoring for all Logststash replicas running in Kubernetes, Filterable by pod, pipeline, and plugin types and names. Rich metrics for High-Levels, Inputs, Filters, and Outputs.
Using on non-Kubernetes deployments? Just change the label and filter pod to instance.
The Helm chart release version uses the label version. This is from Helm's annotations and the Prometheus kubernetes_sd_config.
Uses Prometheus metrics collected exported by kuskoman/logstash-exporter v1.2.0+ Tested against Logstash v8.4.0, Grafana v8.4.7, AWS Managed Prometheus v2.39.1.
Original version based on dpavlos/logstash-monitoring, modernized, adapted to kuskoman/logstash-exporter v1.2.0.
Data source config
Collector config:
Upload an updated version of an exported dashboard.json file from Grafana
| Revision | Description | Created | |
|---|---|---|---|
| Download |
Kubernetes
Monitor your Kubernetes deployment with prebuilt visualizations that allow you to drill down from a high-level cluster overview to pod-specific details in minutes.
Learn more