Open Liberty - mpMetrics-5.0
Created by the Open Liberty observability team
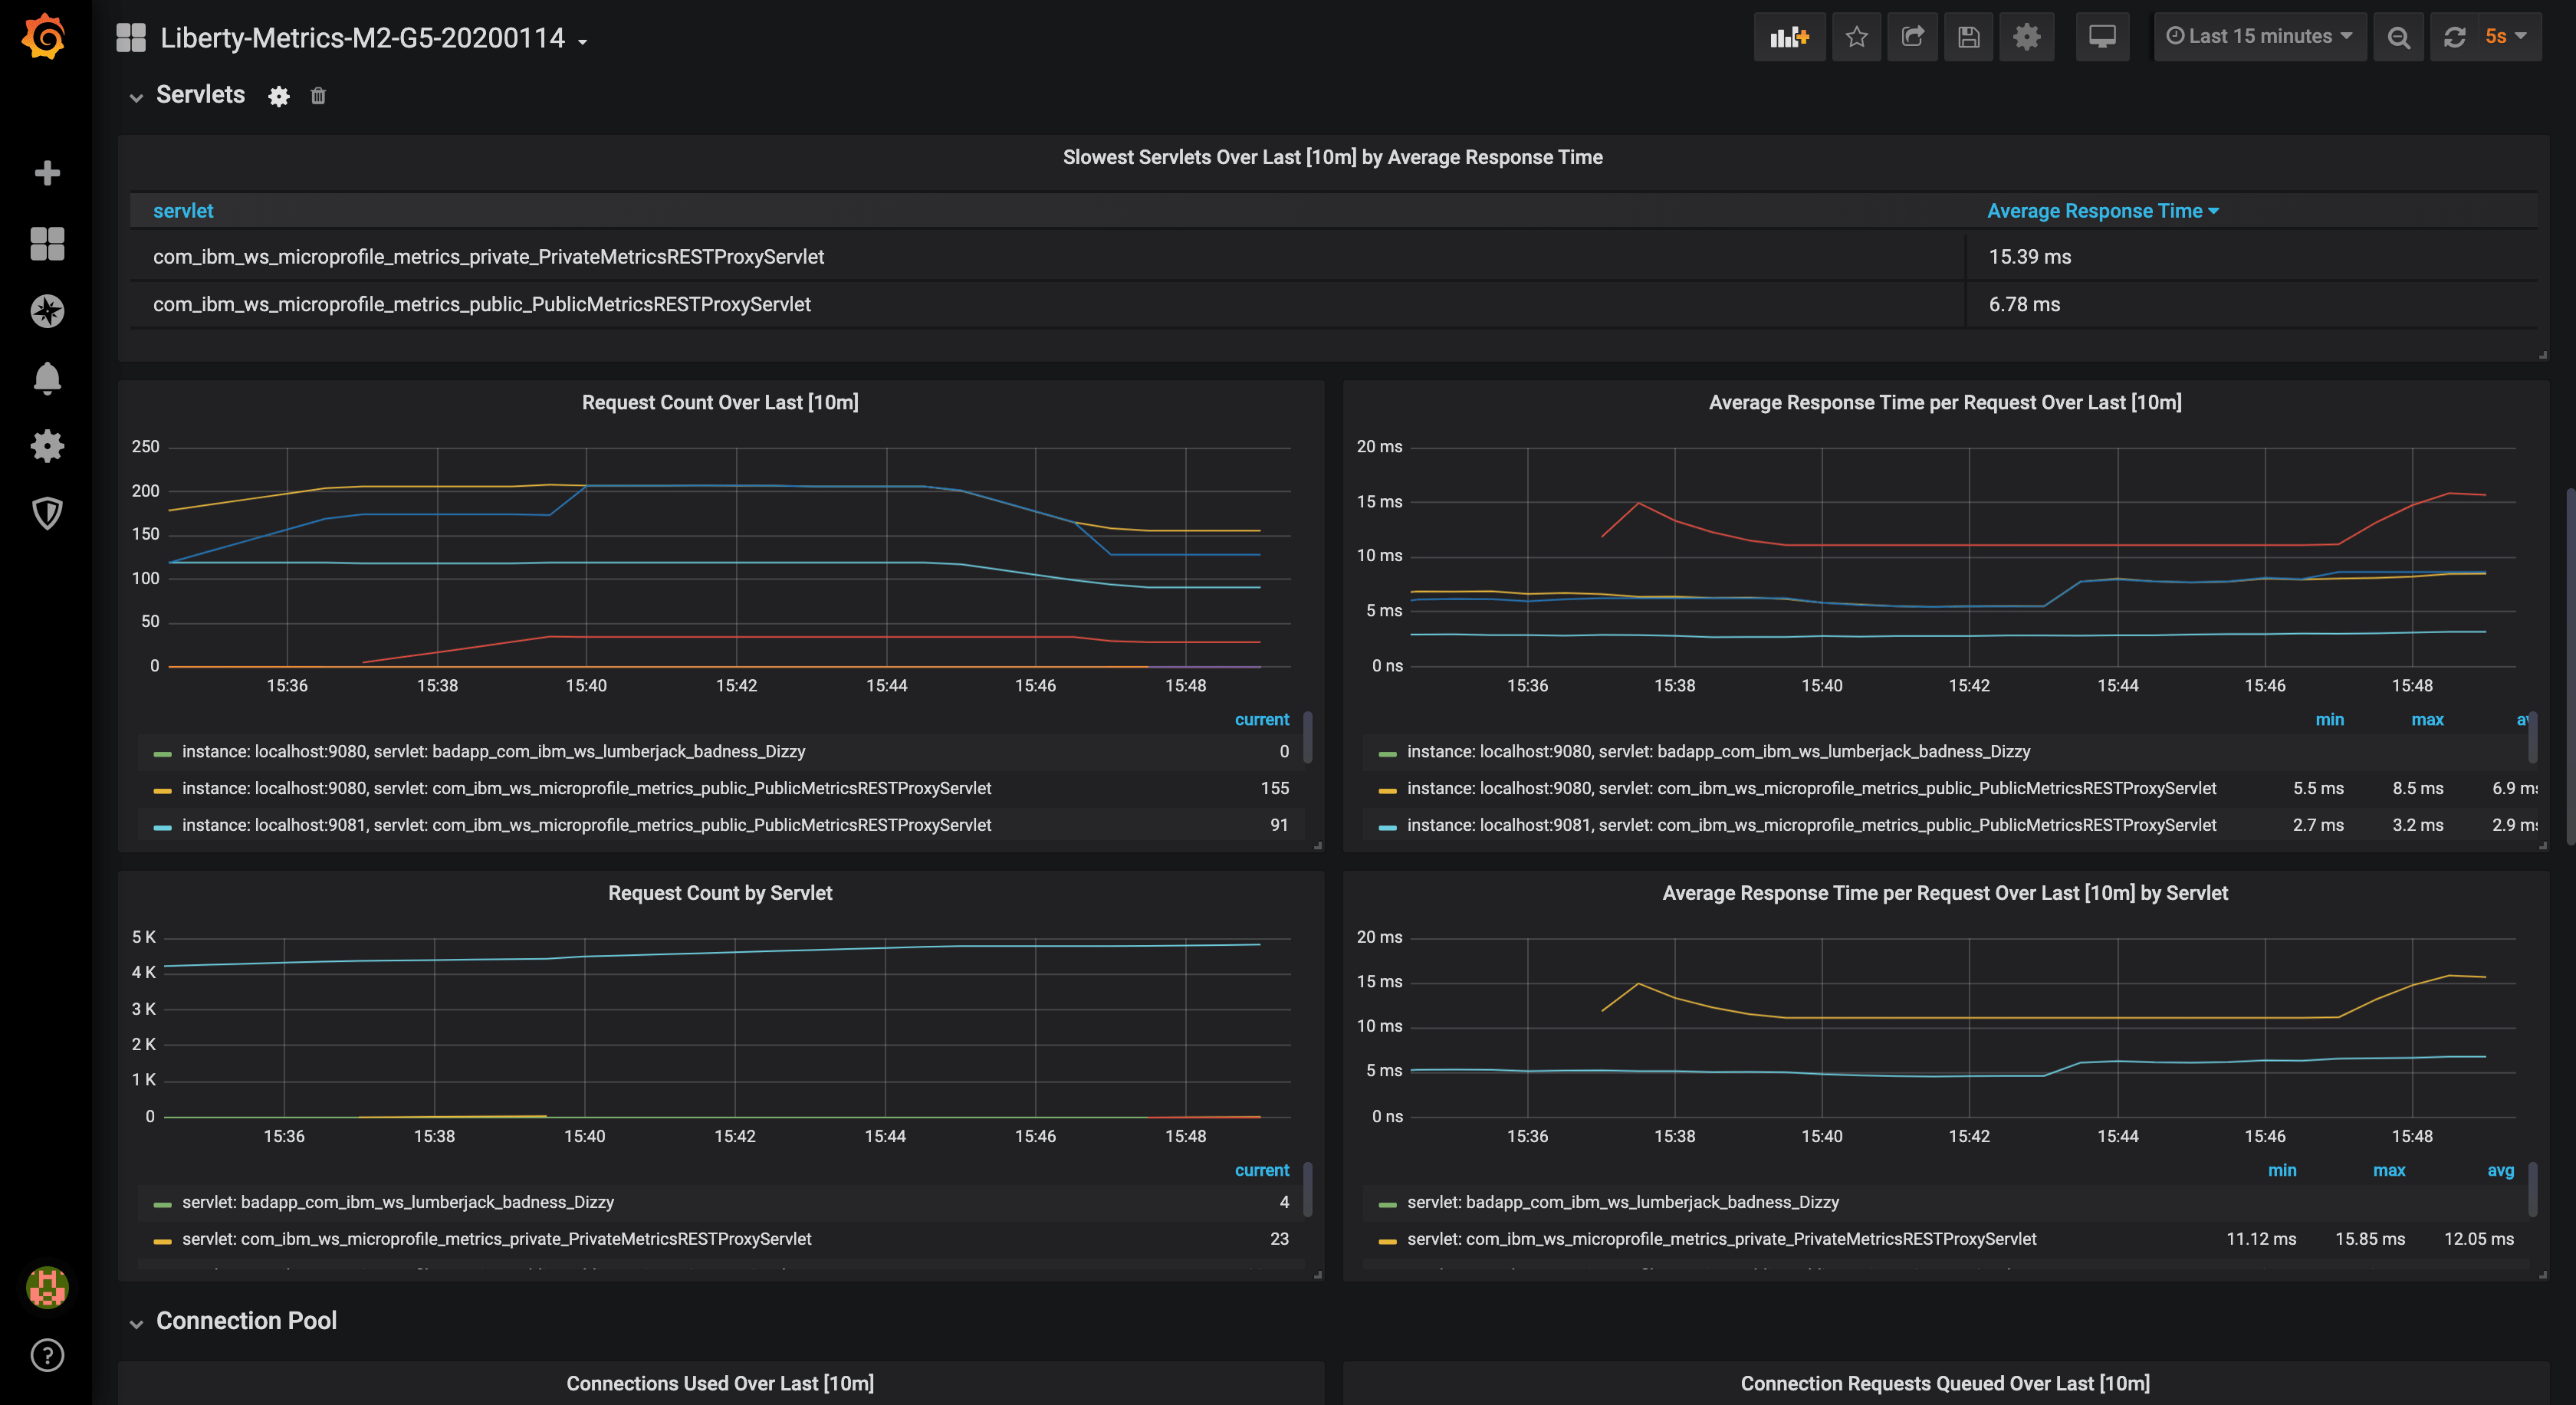
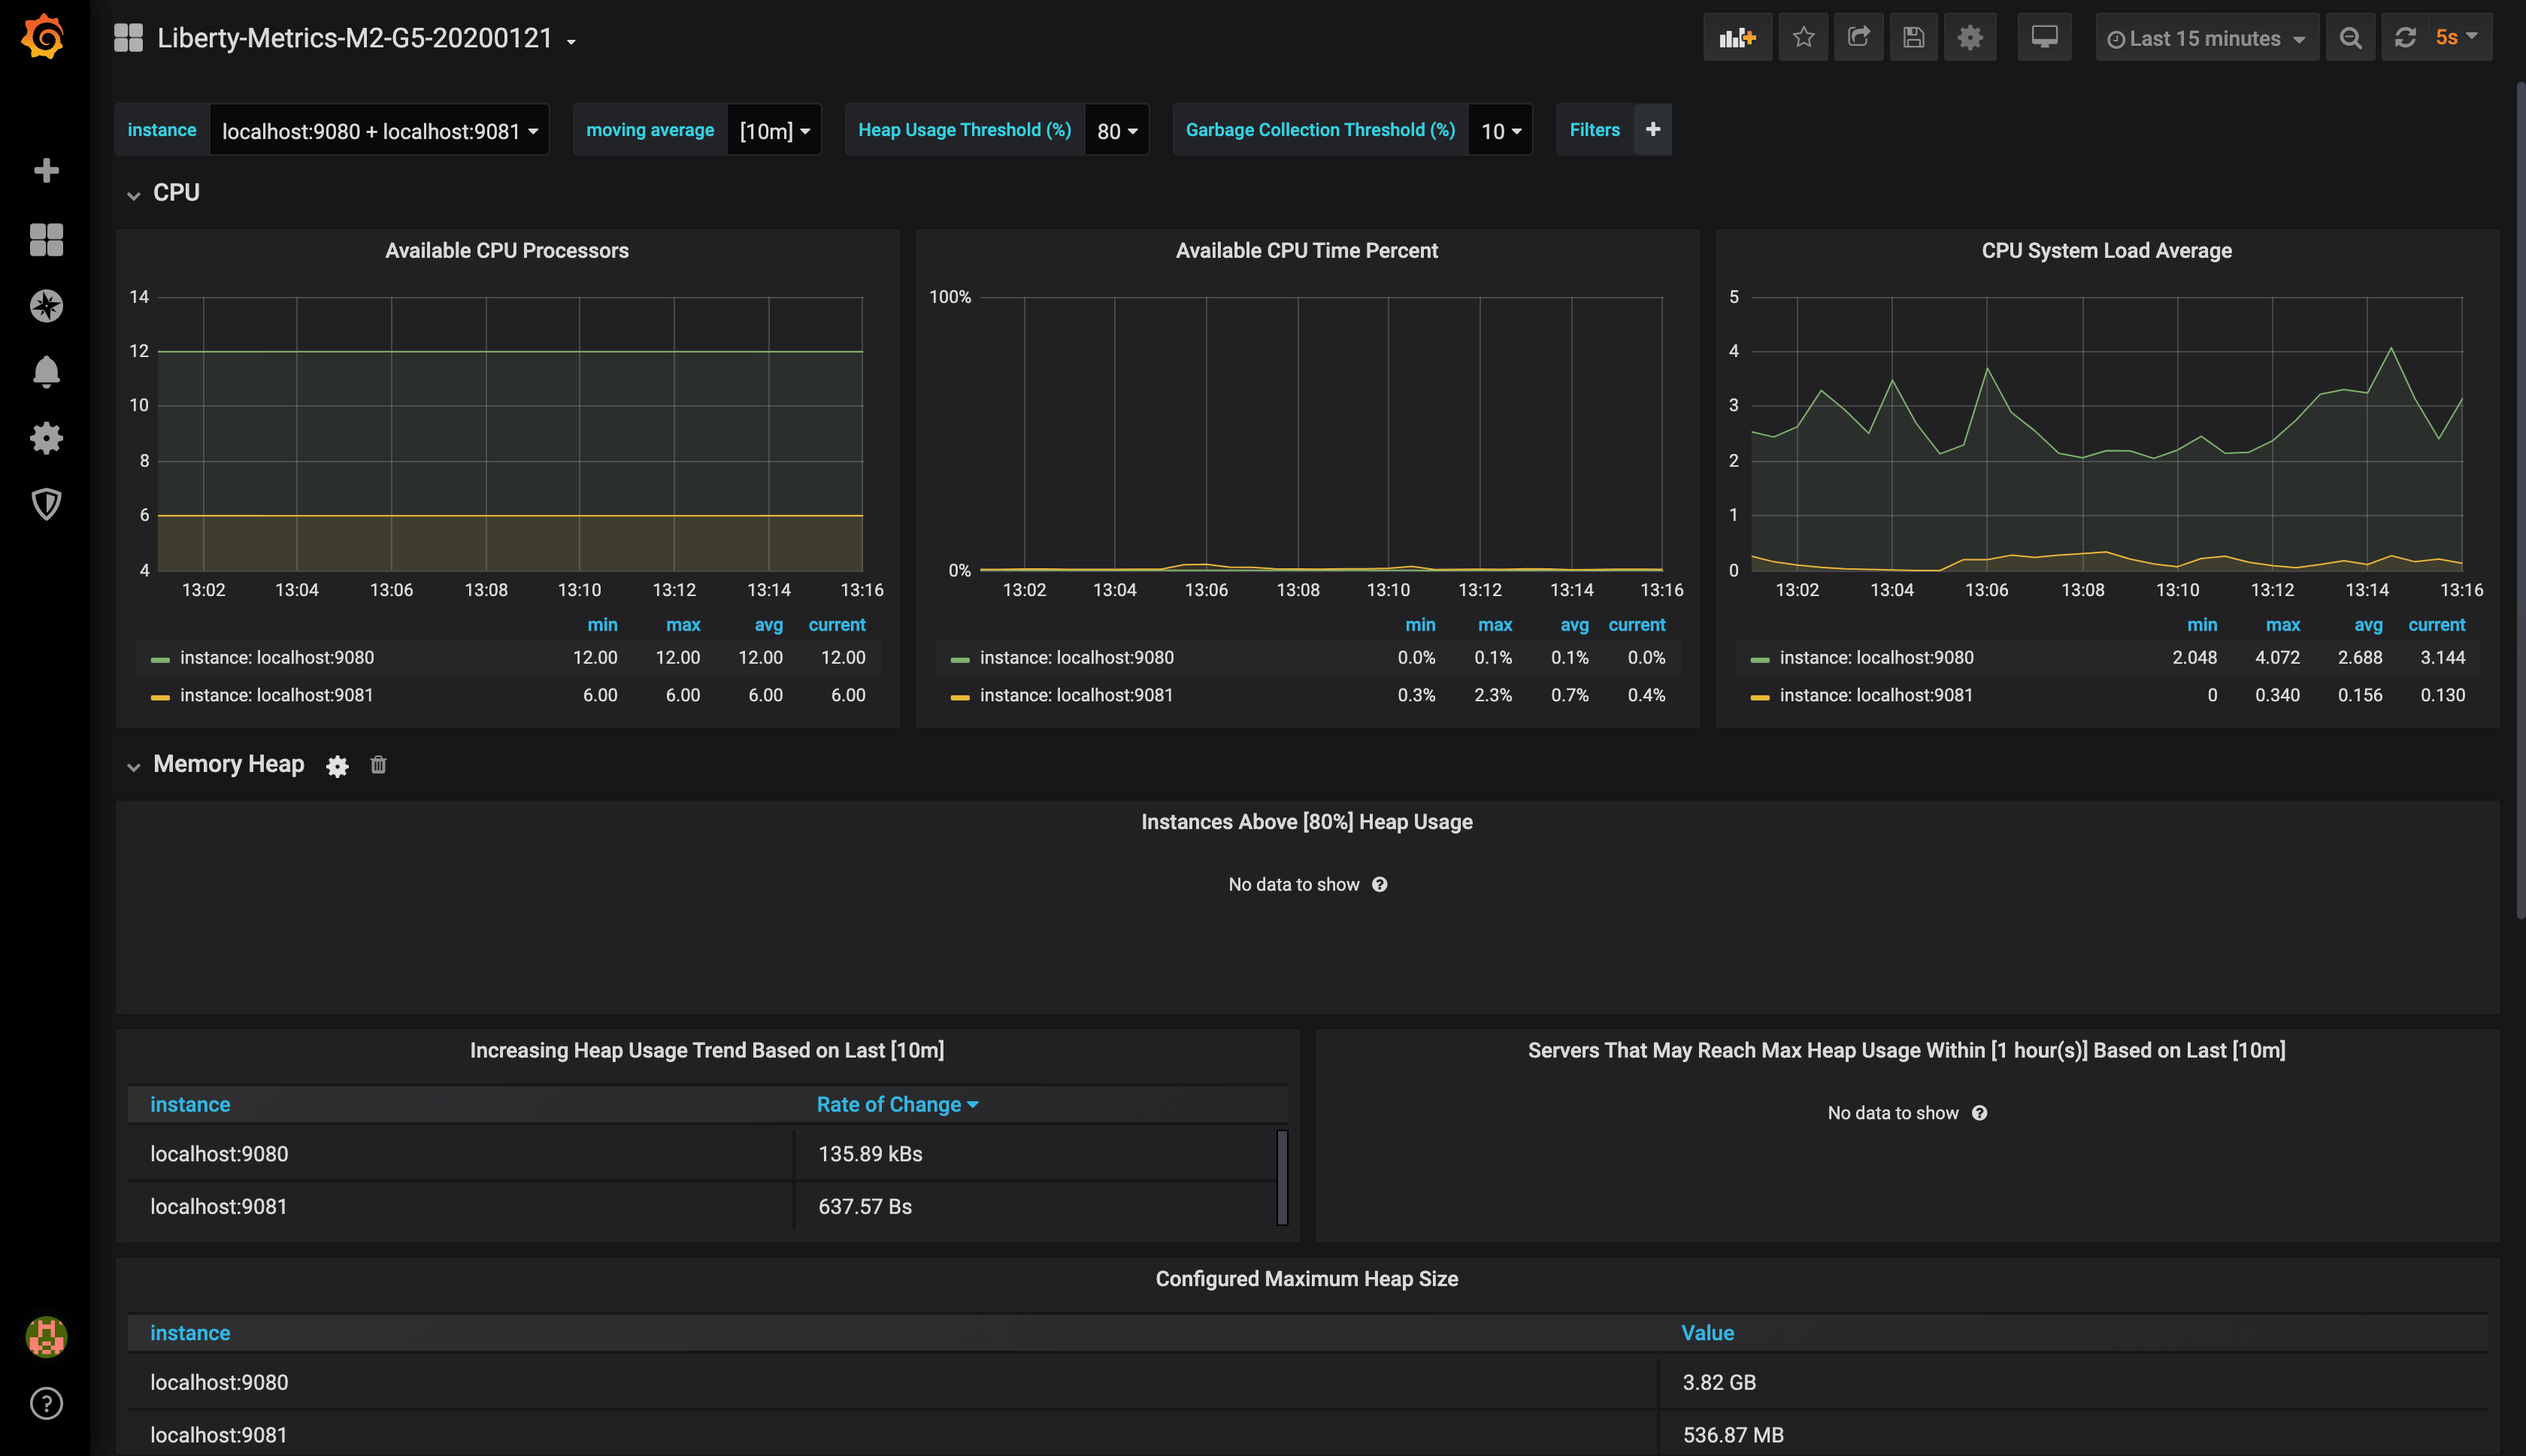
This dashboard visualizes CPU, Heap, REST, Servlet, Connection Pool, Sessions, Threadpool, GC, and other JVM metrics.
This dashboard works with Open Liberty servers running with mpMetrics-5.x feature. For prior mpMetrics versions, use the Open Liberty - mpMetrics-2.x-4.x dashboard
View our Open Liberty MicroProfile 3.3 blog post for detailed setup instructions.
Open Liberty
- Enable the /metrics endpoint by enabling the desired
mpMetricsfeature (e.g.mpMetrics-5.0) in theserver.xml. - Learn about Monitoring with MicroProfile metrics
- Check out our Open Liberty Guide on Providing metrics from a Microservice
Prometheus
Configure the scrape_configs section of prometheus.yml in one of the following ways.
For metrics on an insecure endpoint:
  - job_name: 'liberty'
    scrape_interval: 5s
    static_configs:
      - targets: ['localhost:9080']
For metrics on an secure endpoint using Basic Authentication:
  - job_name: 'liberty-secure'
    scrape_interval: 5s
    static_configs:
      - targets: ['localhost:9443']
    basic_auth:
      username: "<your-username>"
      password: "<your-password>"
    tls_config:
      insecure_skip_verify: true
    scheme: "https"
Data source config
Collector type:
Collector plugins:
Collector config:
Revisions
Upload an updated version of an exported dashboard.json file from Grafana
| Revision | Description | Created | |
|---|---|---|---|
| Download |