Unique Data Usage
Unique Data dashboard, display the master objects and bytes consumed at both cluster level and each namespace in the cluster
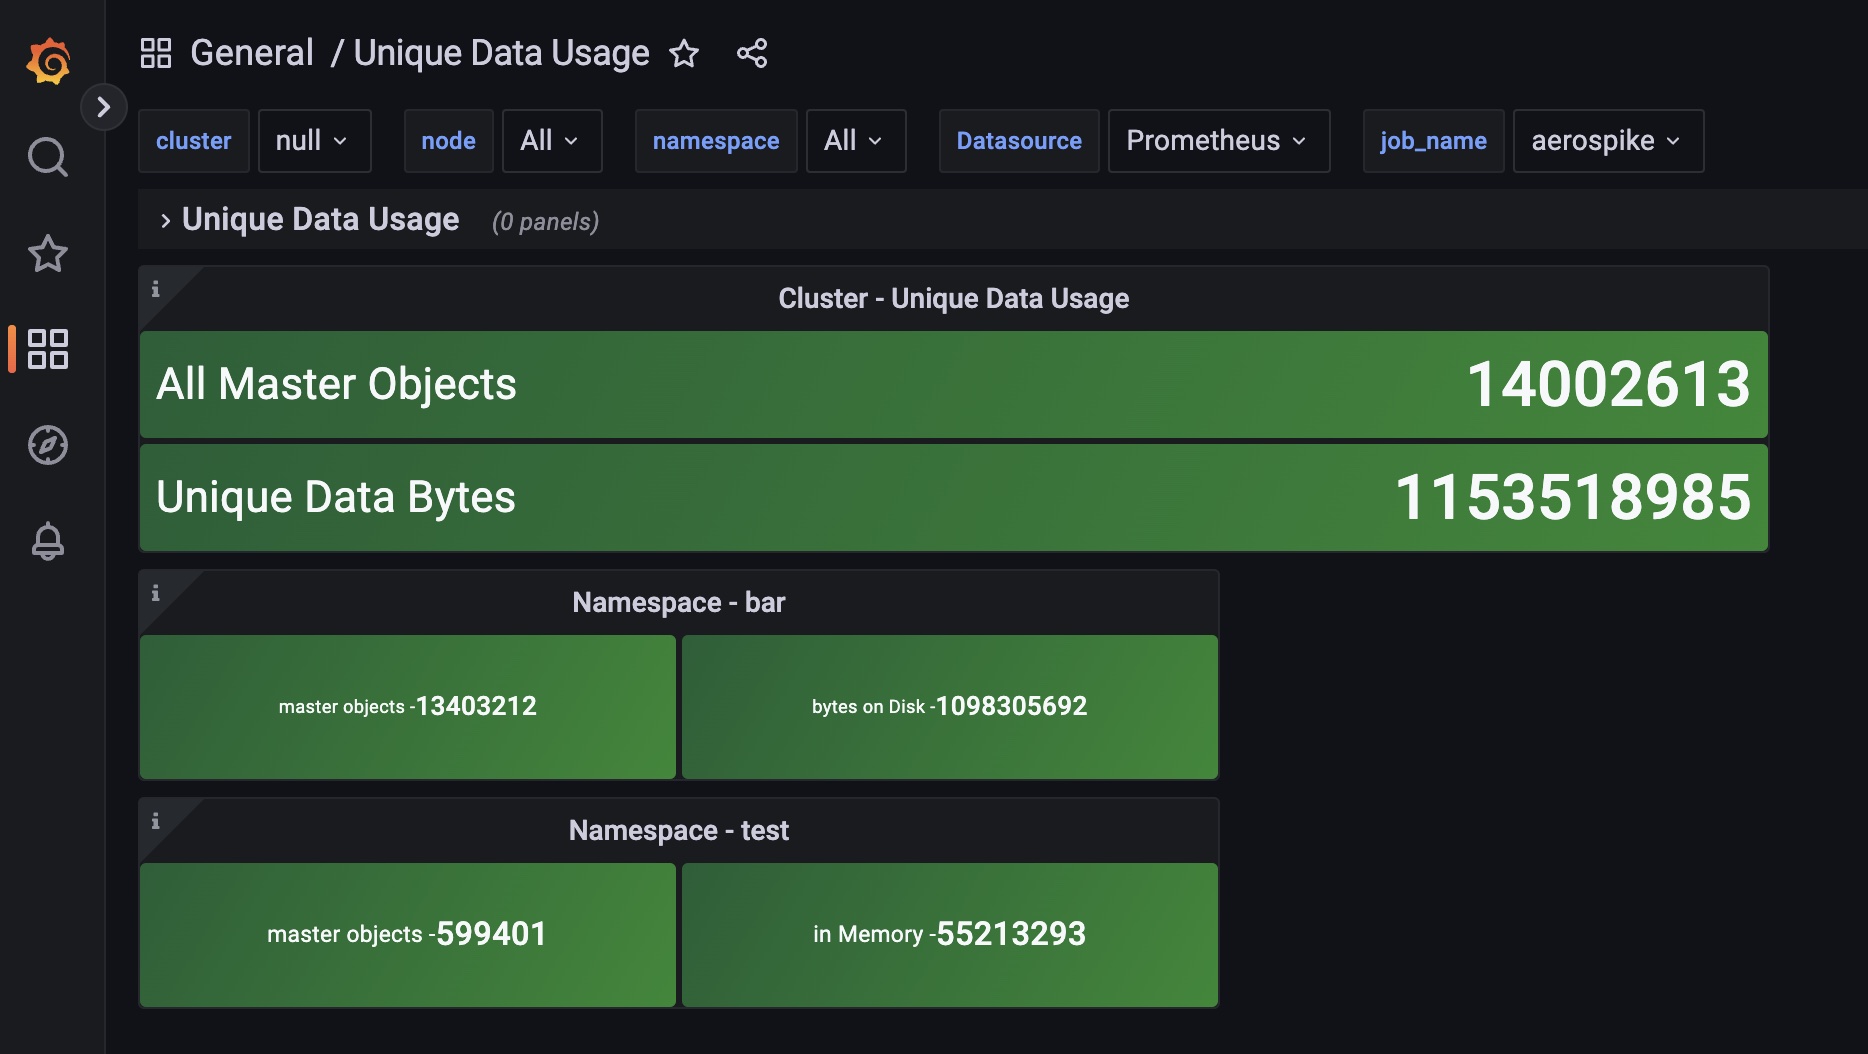
Unique data dashboard, display the master objects count and bytes consumed at both cluster level and each namespace in the cluster Note: If the cluster is not stable or data is missing from some nodes, dashboard will show "No Data"
Unique data dashboard for Aerospike Monitoring Stack
Aerospike's Monitoring Stack extracts operational metrics from Aerospike database clusters for visualization and analysis in Prometheus and Grafana.
See Aerospike Monitoring Stack Architecture and Aerospike Monitoring Stack Installation for more details
Data source config
Collector type:
Collector plugins:
Collector config:
Revisions
Upload an updated version of an exported dashboard.json file from Grafana
| Revision | Description | Created | |
|---|---|---|---|
| Download |