Apache Logs and Metrics
Visualize apache logs.
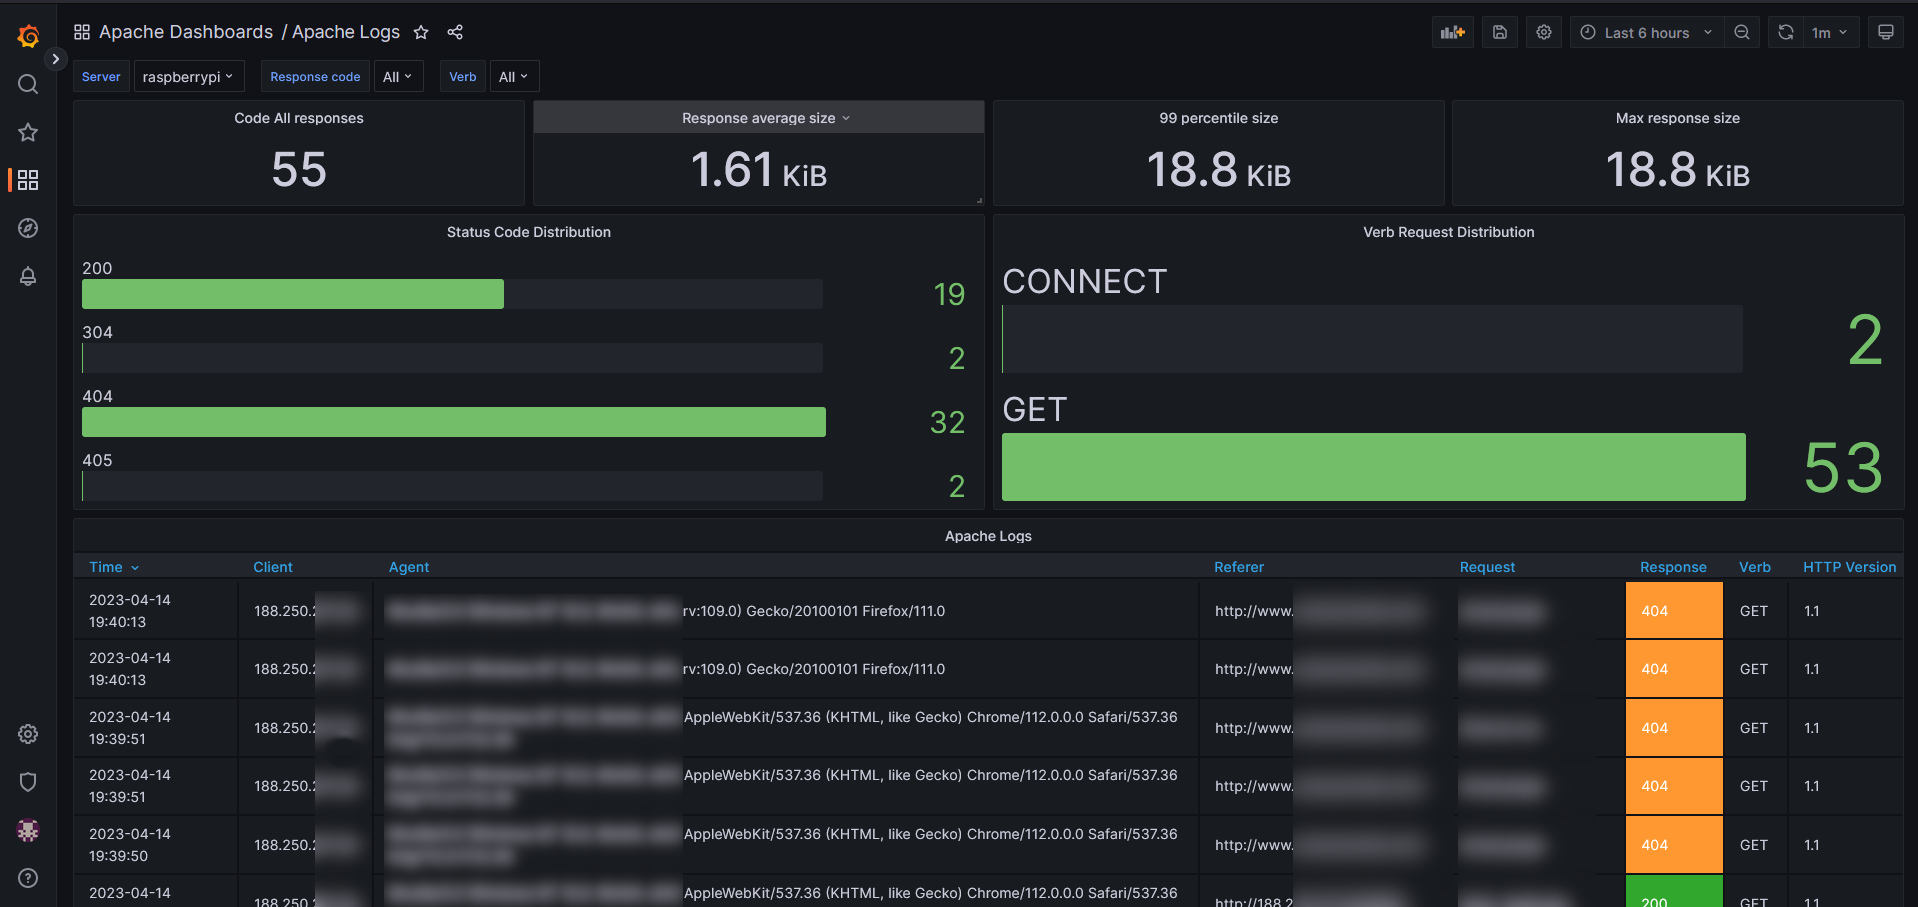
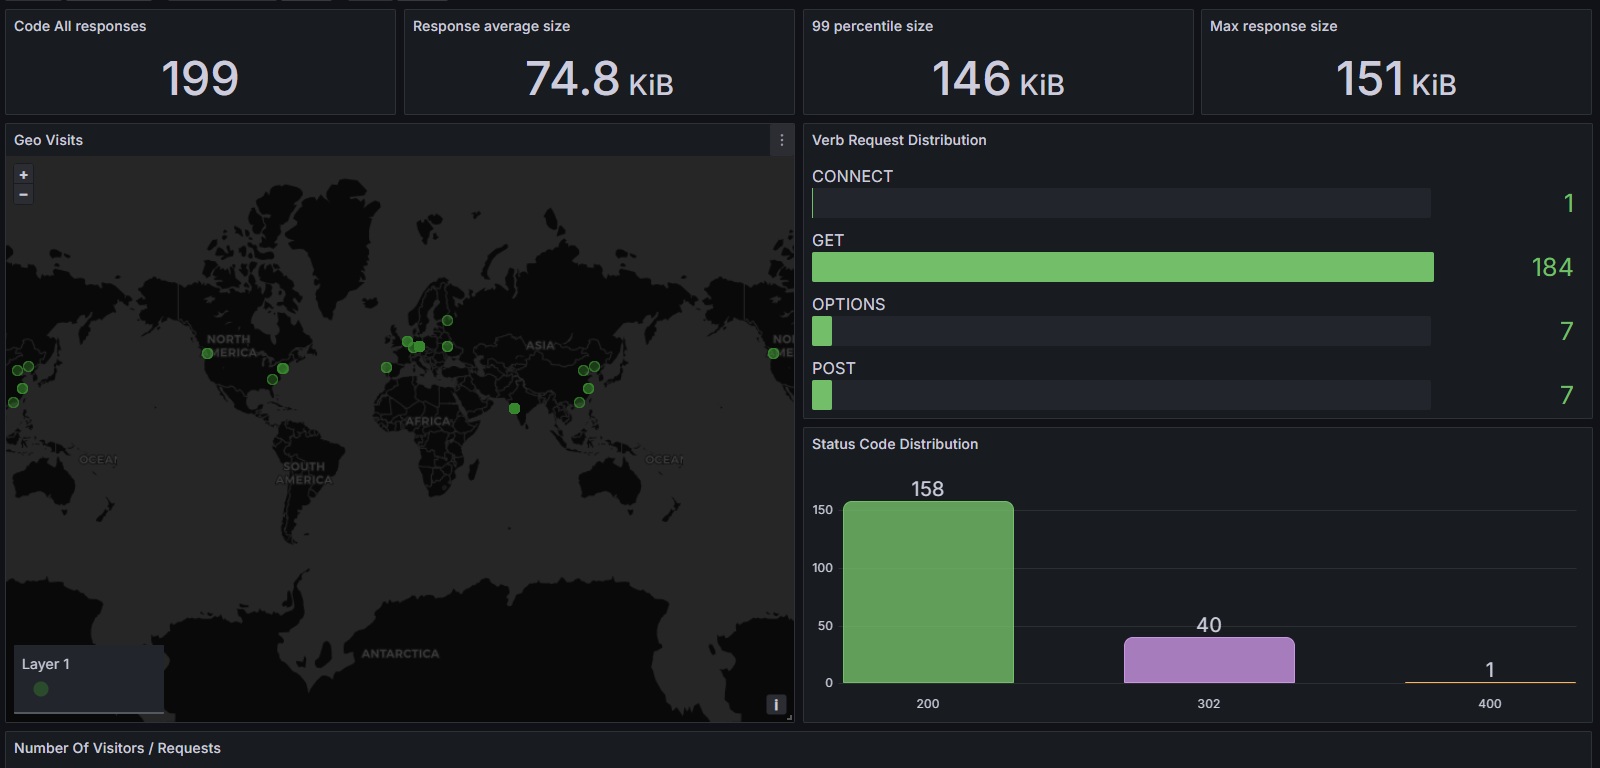
Revamped Apache Logs dashboard, which was originally created by Nicolas Zachow (ID 968).
The original one was not working on my setup, so I reworked it.
Data source config
Collector type:
Collector plugins:
Collector config:
Revisions
Upload an updated version of an exported dashboard.json file from Grafana
| Revision | Description | Created | |
|---|---|---|---|
| Download |
Grafana Loki (self-hosted)
Easily monitor Grafana Loki (self-hosted), a horizontally scalable, highly available, multi-tenant log aggregation system inspired by Prometheus, with Grafana Cloud's out-of-the-box monitoring solution.
Learn more