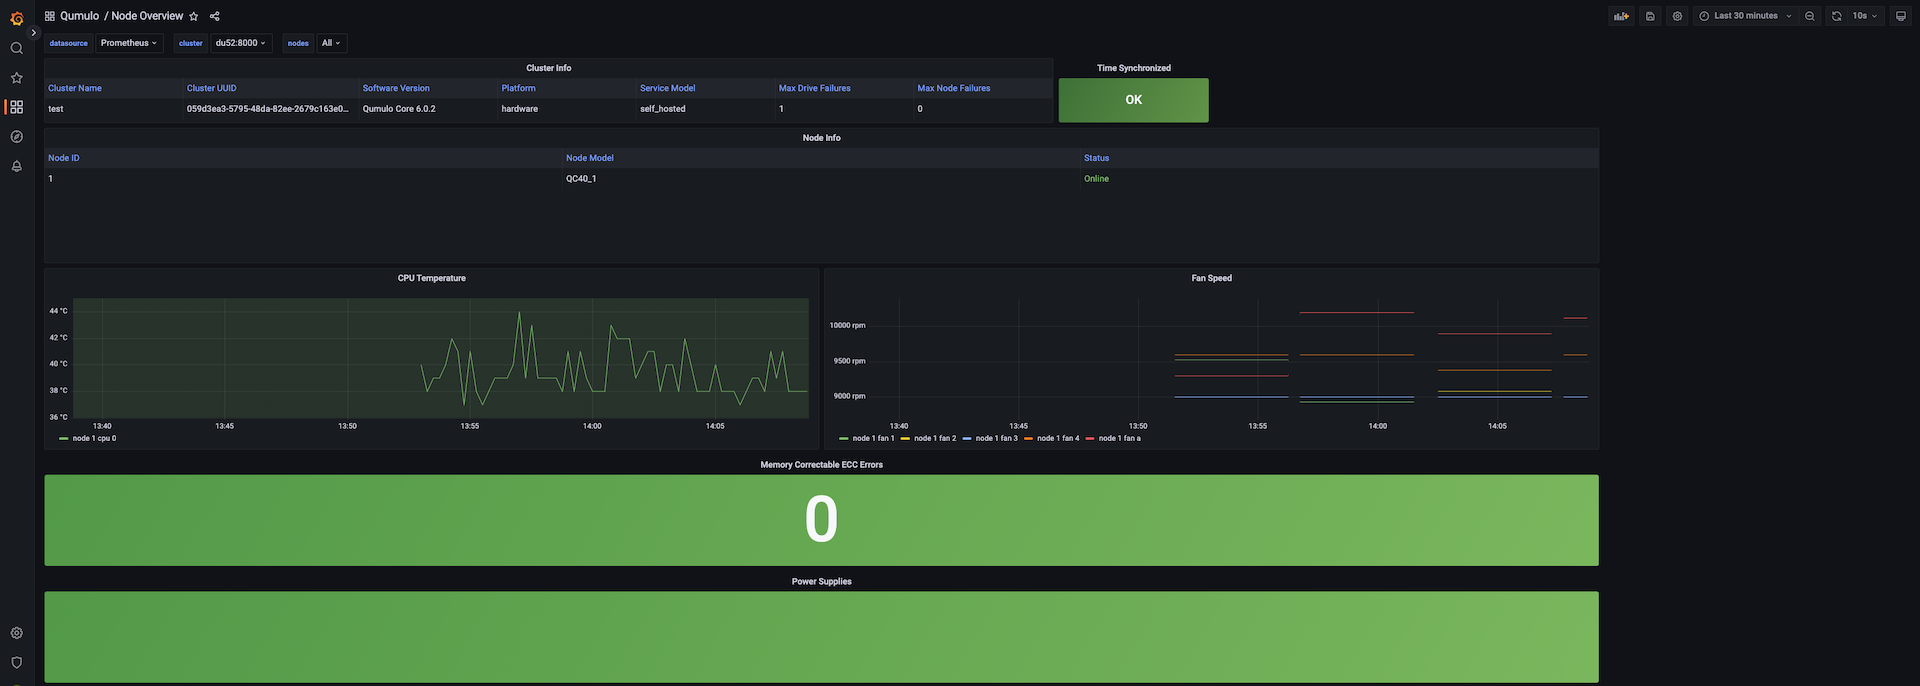
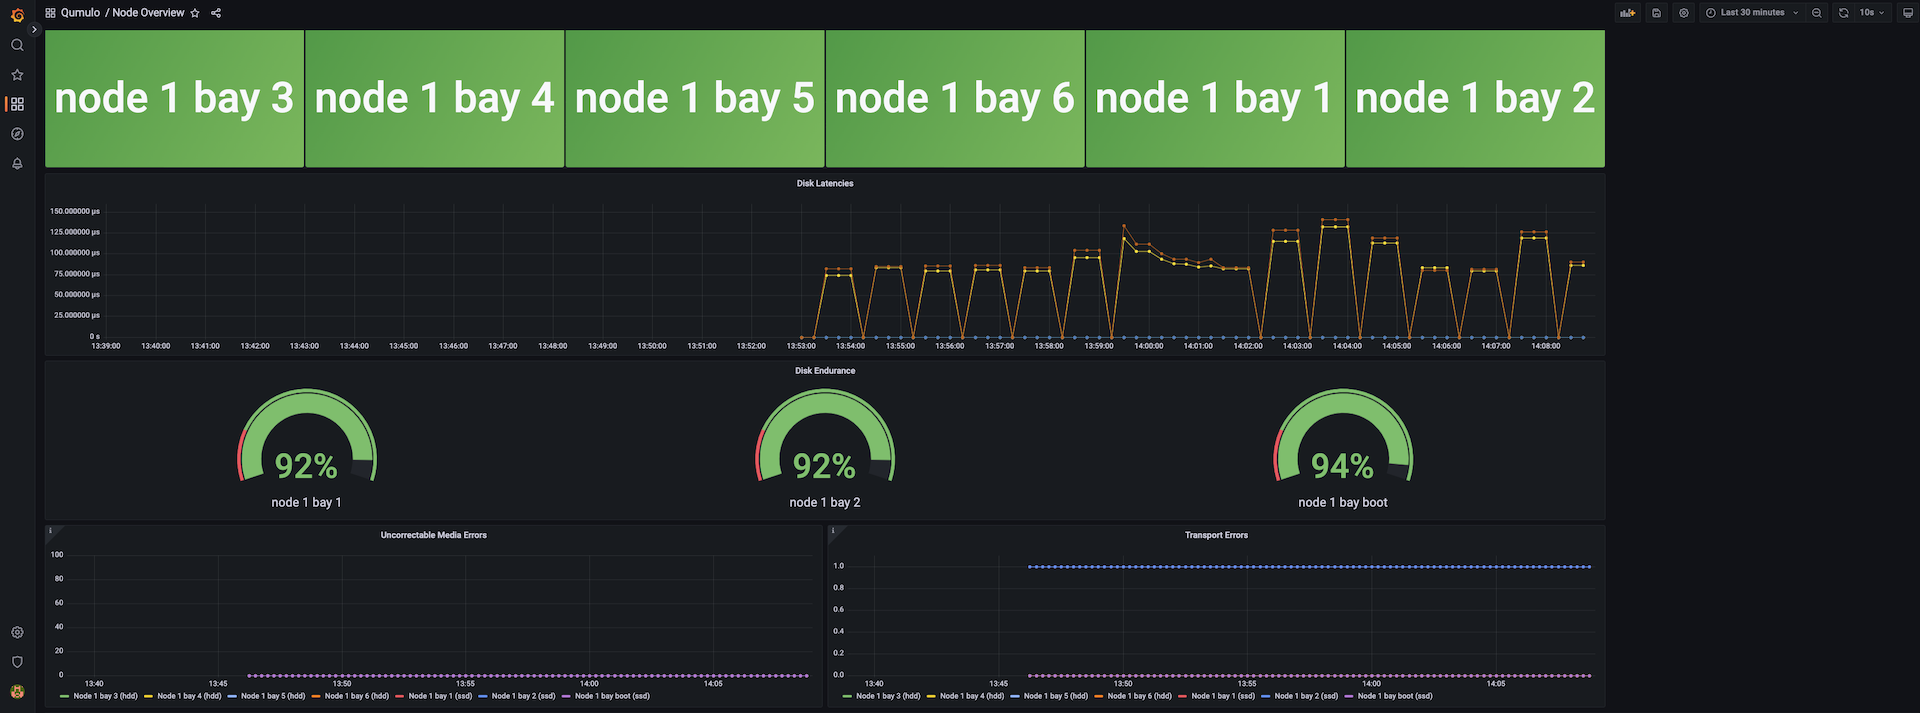
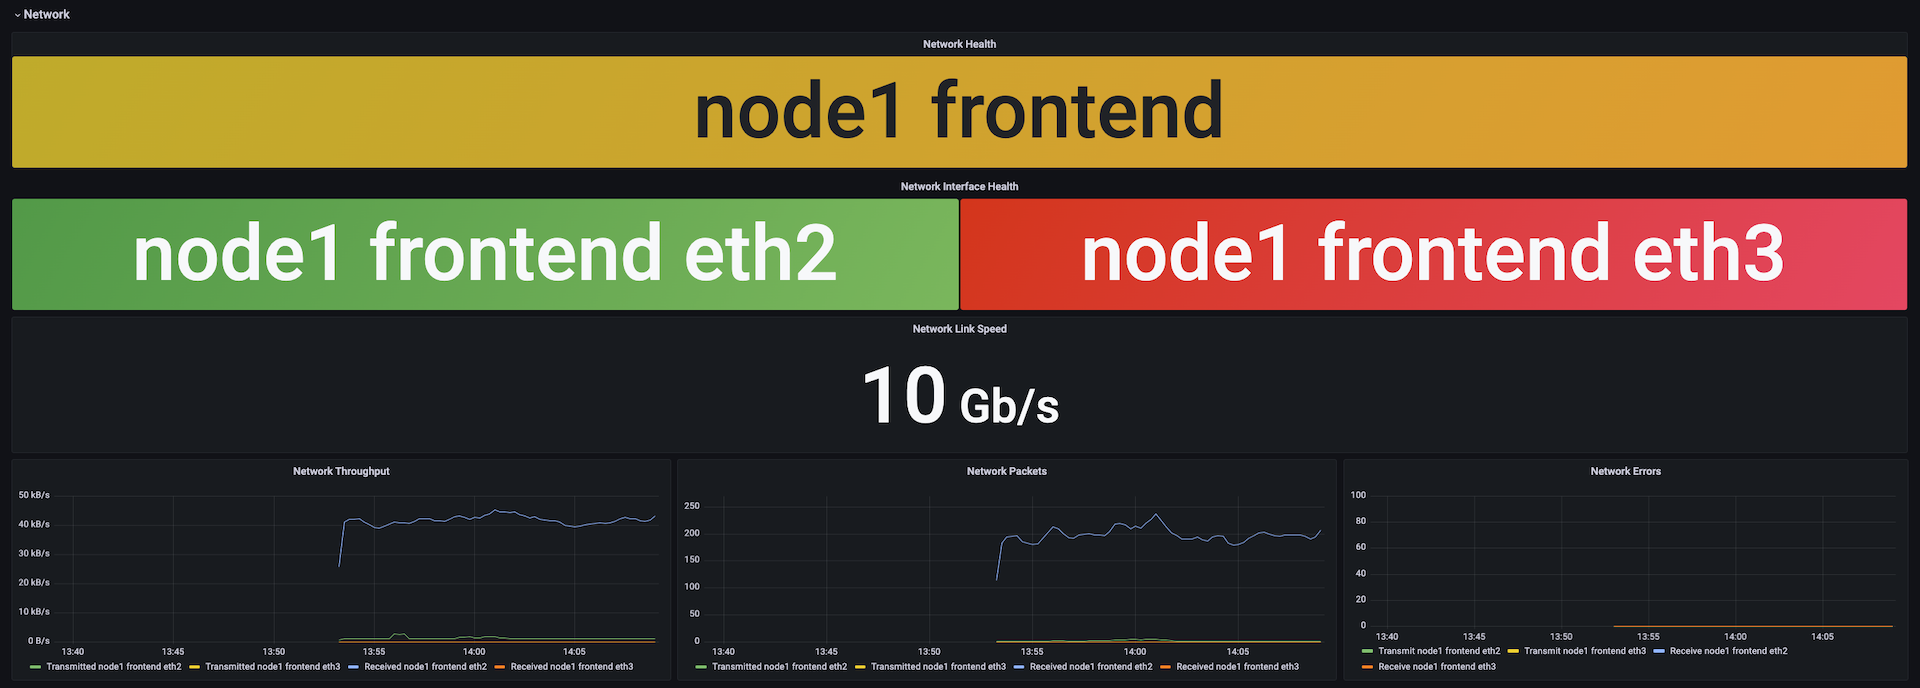
Qumulo Node Overview
Node-specific OpenMetrics from your Qumulo cluster
See the state of your Qumulo cluster at a glance. This dashboard includes all node-specific metrics from the Qumulo OpenMetrics REST API. Compatible with Qumulo version 6.0.2+
For a complete, easily deployable package which includes both Grafana dashboards backed by a Prometheus time-series database, visit our Github: https://github.com/Qumulo/qumulo-monitoring-dashboard
Data source config
Collector config:
Upload an updated version of an exported dashboard.json file from Grafana
| Revision | Description | Created | |
|---|---|---|---|
| Download |
Linux Server
Monitor Linux with Grafana. Easily monitor your Linux deployment with Grafana Cloud's out-of-the-box monitoring solution.
Learn more


