Kubernetes Logs from Loki
Basic dashboard for Kubernetes Logs from Loki. You will need to make your own customizations.
This is a modified version from the dashboard promoted in the Grafana blog (see here). The original didn't work out of the box for me and was missing some features.
Features
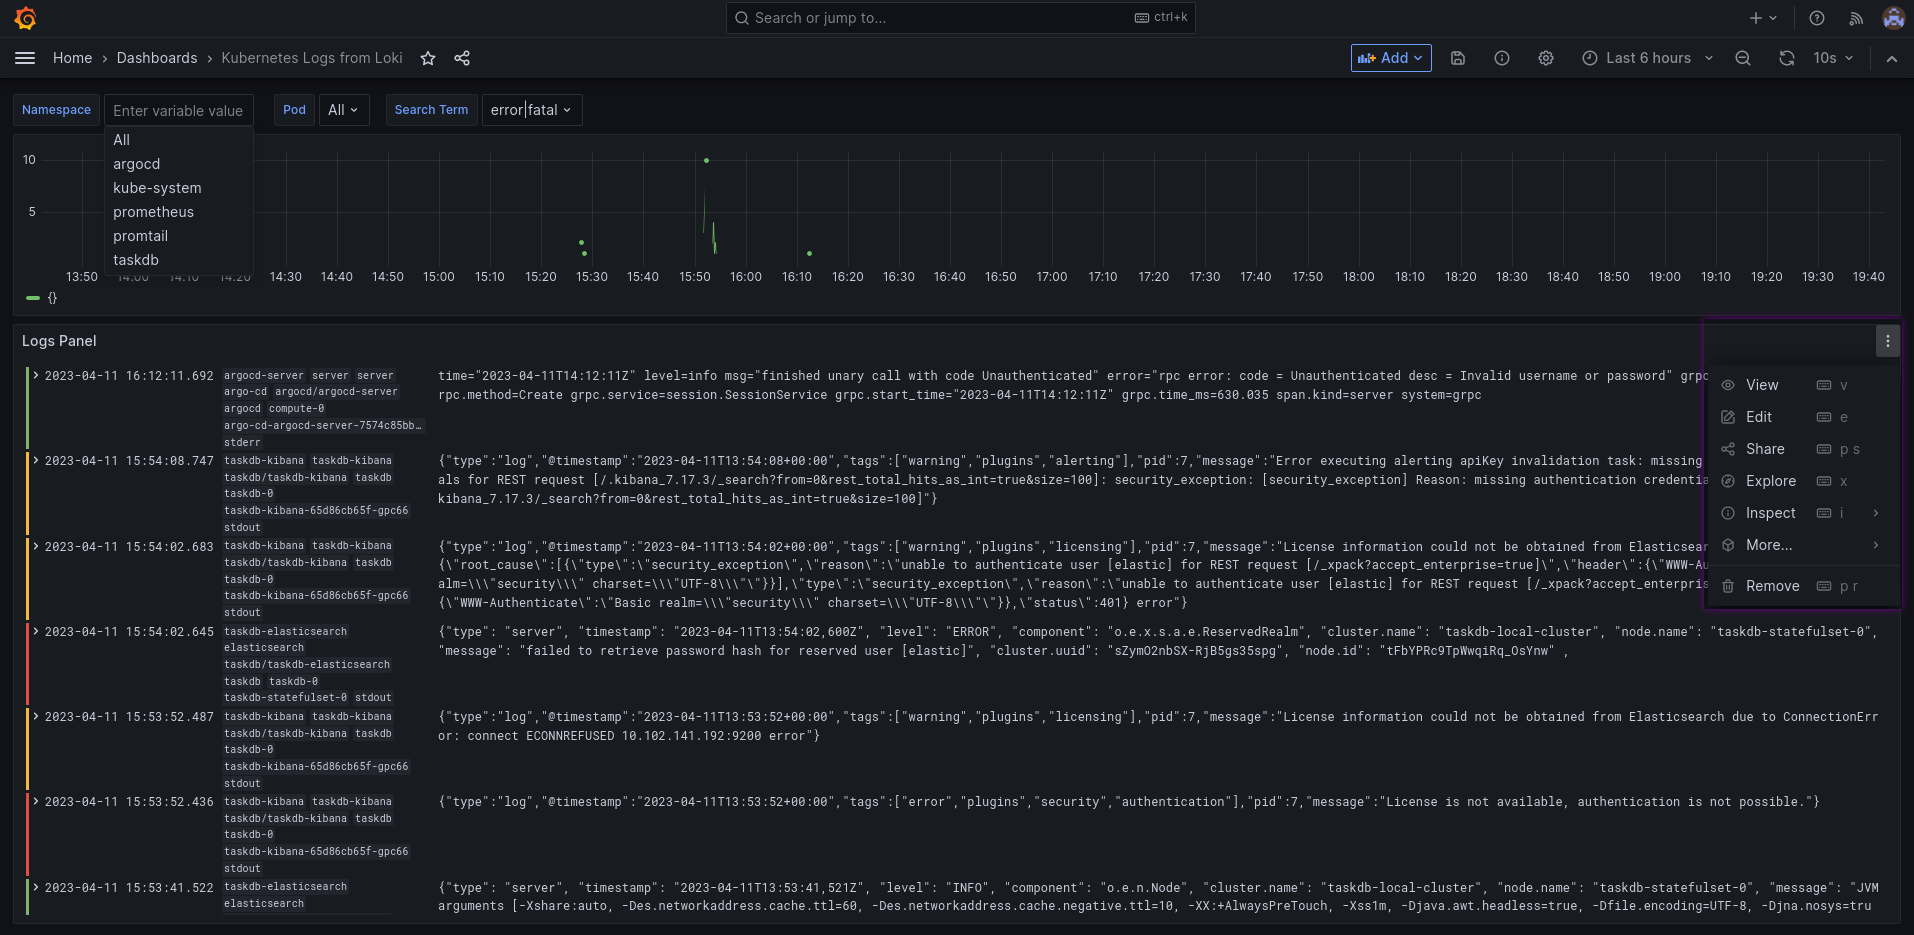
- Allows to filter by namespaces & pods
- Allows to search for strings via regex
- Auto-refresh is enabled by default
Notes
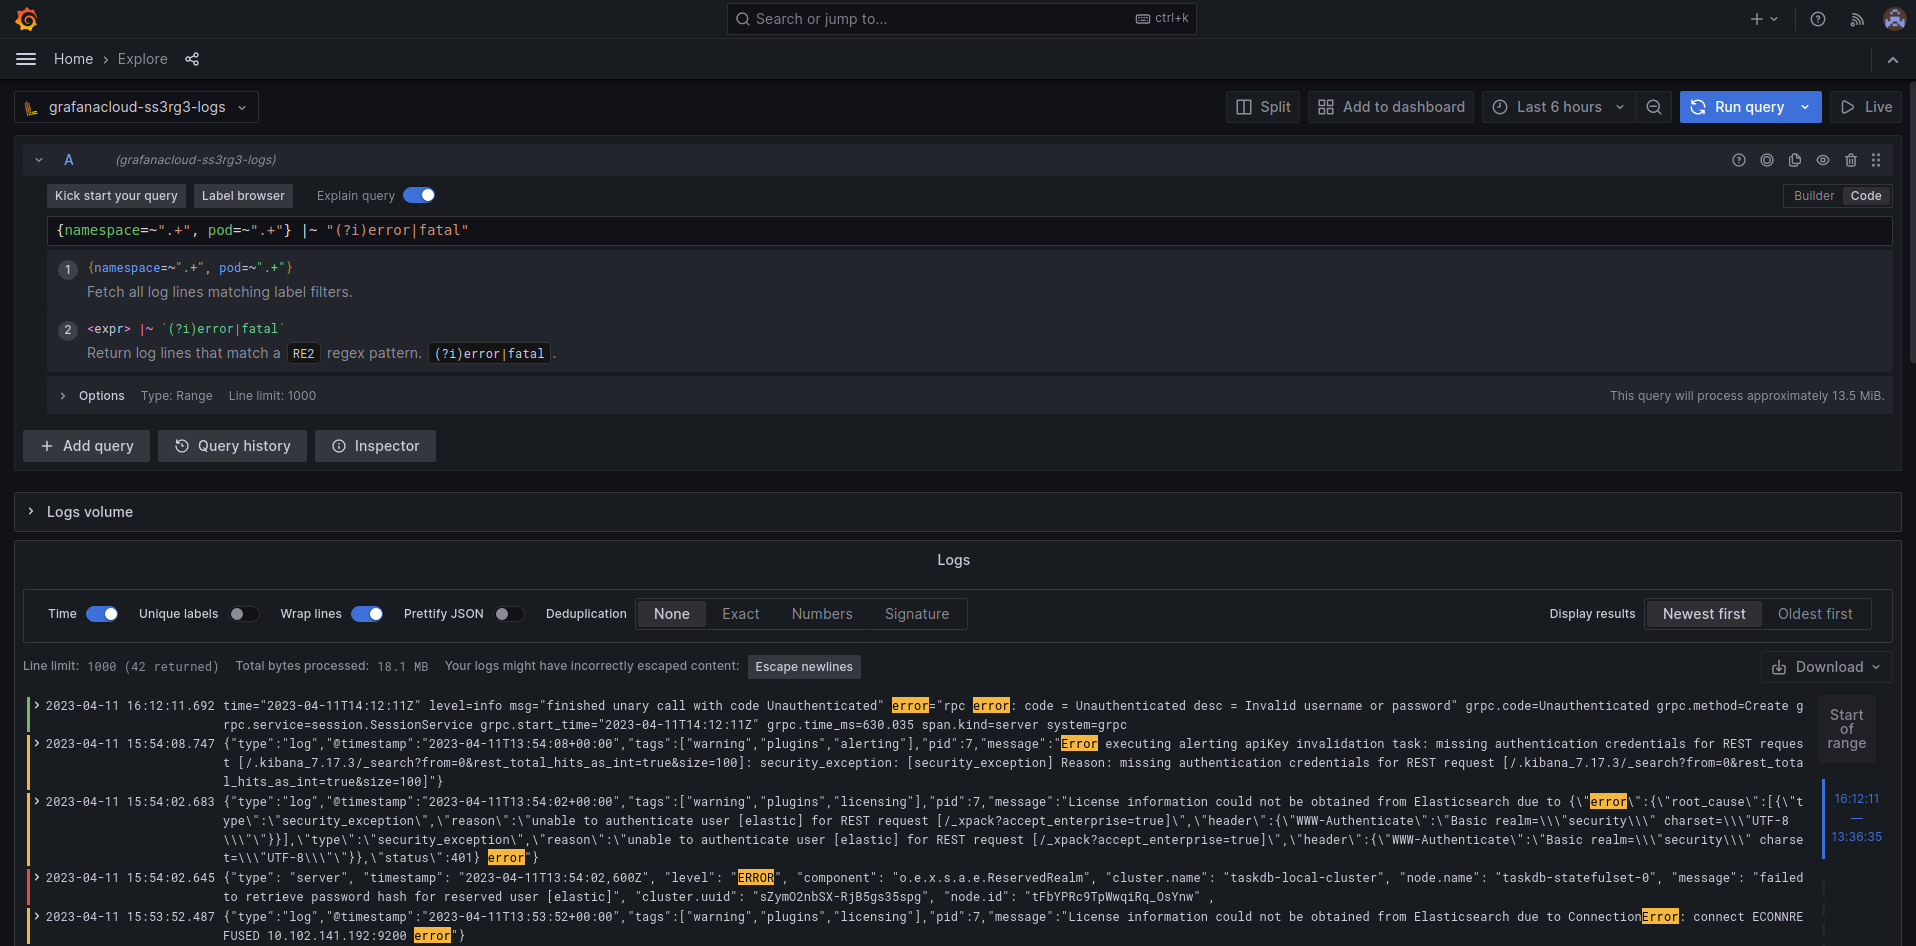
- If you want to see the context of a log then click on "Explore" in the log panel
- You can search for any terms, not only the predefined ones
You will probably need to do your own customizations.
Data source config
Collector type:
Collector plugins:
Collector config:
Revisions
Upload an updated version of an exported dashboard.json file from Grafana
| Revision | Description | Created | |
|---|---|---|---|
| Download |
Kubernetes
Monitor your Kubernetes deployment with prebuilt visualizations that allow you to drill down from a high-level cluster overview to pod-specific details in minutes.
Learn more