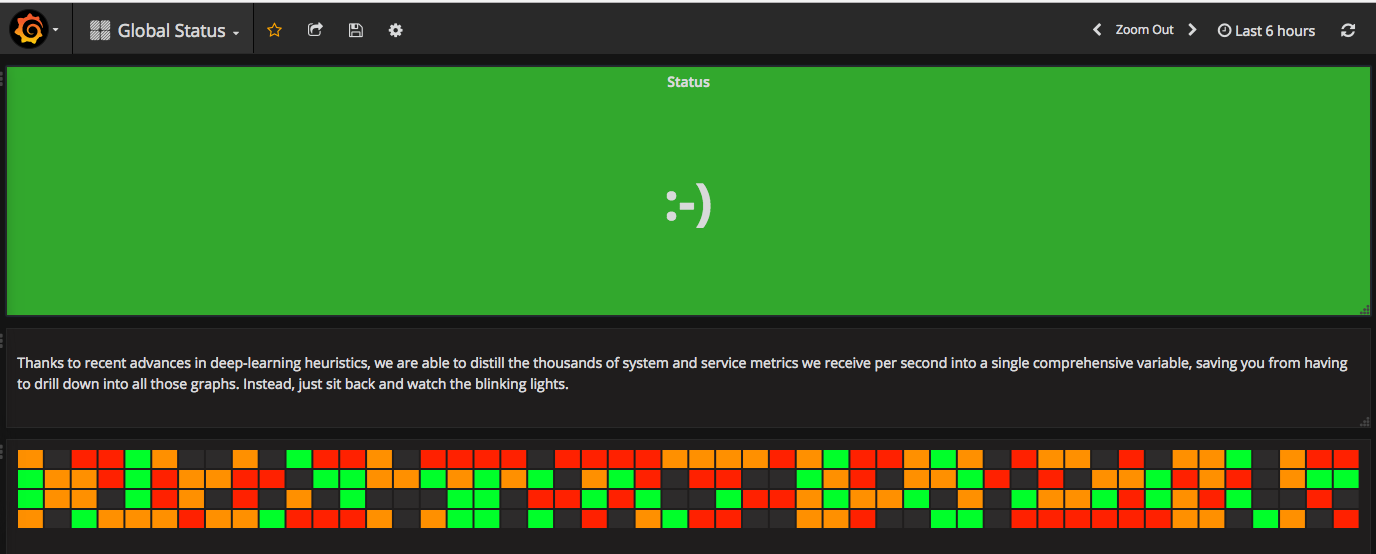
Global Status
Throw away those pesky detailed graphs, they're really mostly noise anyways.
So I was sitting there, looking at my dozen Grafana deployments, with over a hundred dashboards, and said to myself "self, this is getting ridiculous. The users and management don't even really want all these graphs anyways, they just want to know if their systems and services are ok." With that realization, I threw all those dashboards away and created a single, very simple dashboard, that utilizes the latest in deep learning heuristics to distill the thousands of monitoring streams, user browsing history, and the coffee pot status into a single comprehensive status.
The dashboard seemed a little too simple though, so I also added some blinking lights to show how much work was happening behind the scenes. If it's not in the Grafana plugin list, just clone the repo into your plugins directory.
Data source config
Collector config:
Upload an updated version of an exported dashboard.json file from Grafana
| Revision | Description | Created | |
|---|---|---|---|
| Download |

