Database Status Dashboard
Redis Enterprise Software Database Dashboards
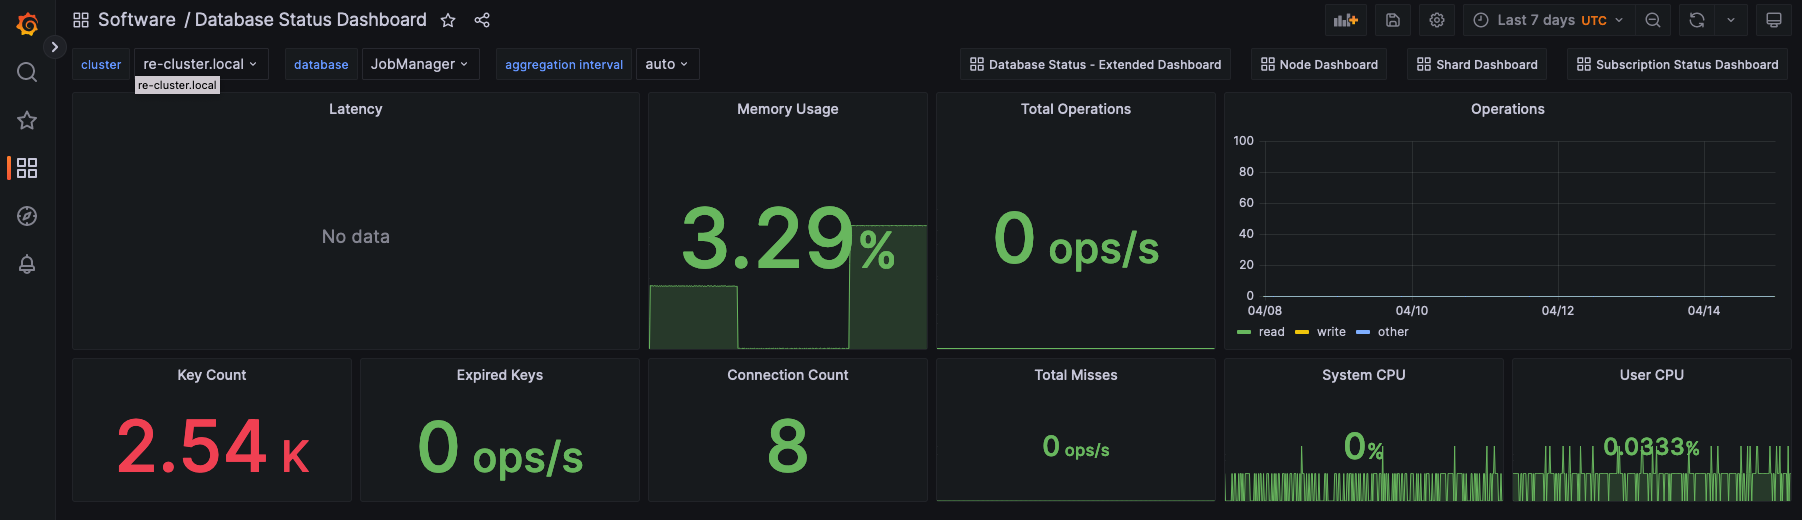
This dashboard summarizes metrics for your Redis Enterprise Software databases. Some of the available metrics include the following:
- Latency
- Memory usage
- Operations per second
- Key count
- Expired keys
- Connection count
- Cache misses
- CPU
Redis Software Dashboards
To effectively monitor your Redis Enterprise Software deployment, we recommend the following Grafana dashboards:
- Redis Software Cluster Dashboard
- Redis Software Database Dashboard
In addition to these dashboards, we recommend the cluster node and shard dashboards:
Documentation
To view the complete set of available Redis Cloud dashboards, see the Redis Enterprise Grafana Dashboards Github repository.
Support
The Redis Grafana dashboards are supported by Redis, Inc. on a good faith effort basis. To report bugs, request features, or receive assistance, please file an issue.
License
These dashboards and configurations are licensed under the MIT License. Copyright (C) 2023 Redis, Inc.
Data source config
Collector config:
Upload an updated version of an exported dashboard.json file from Grafana
| Revision | Description | Created | |
|---|---|---|---|
| Download |