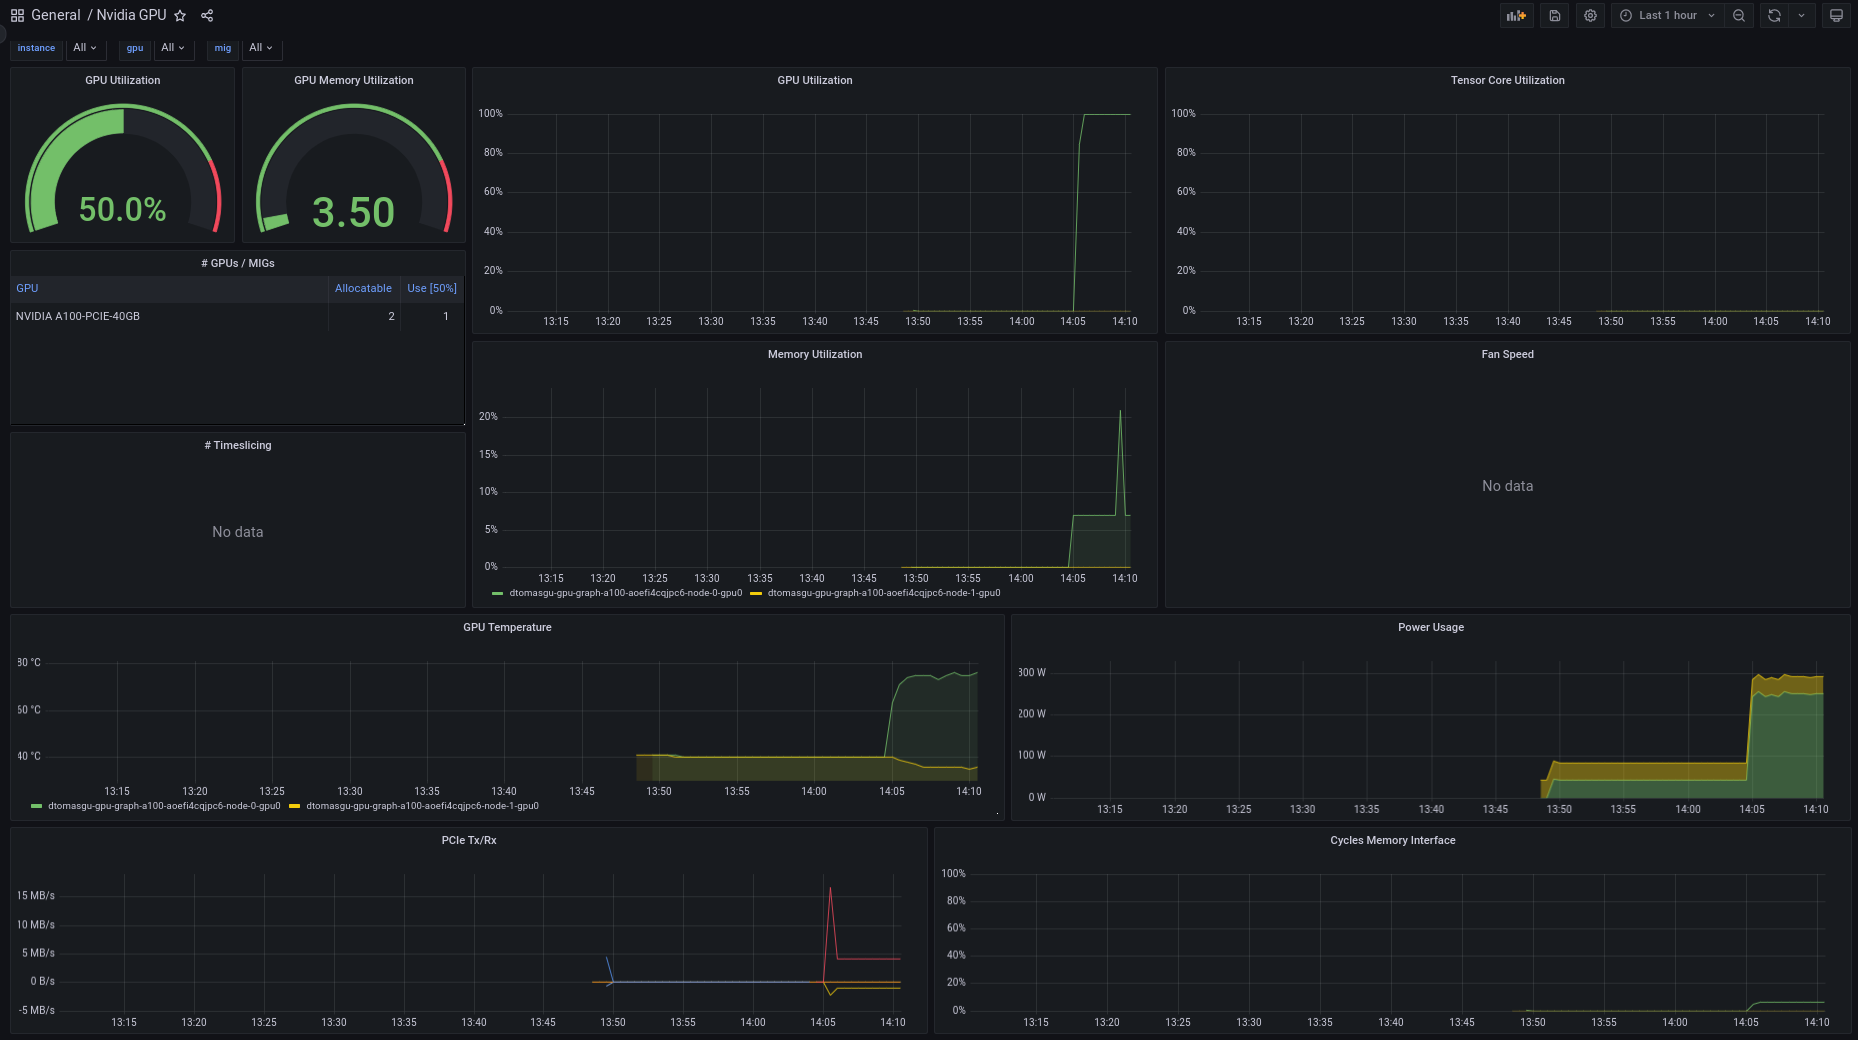
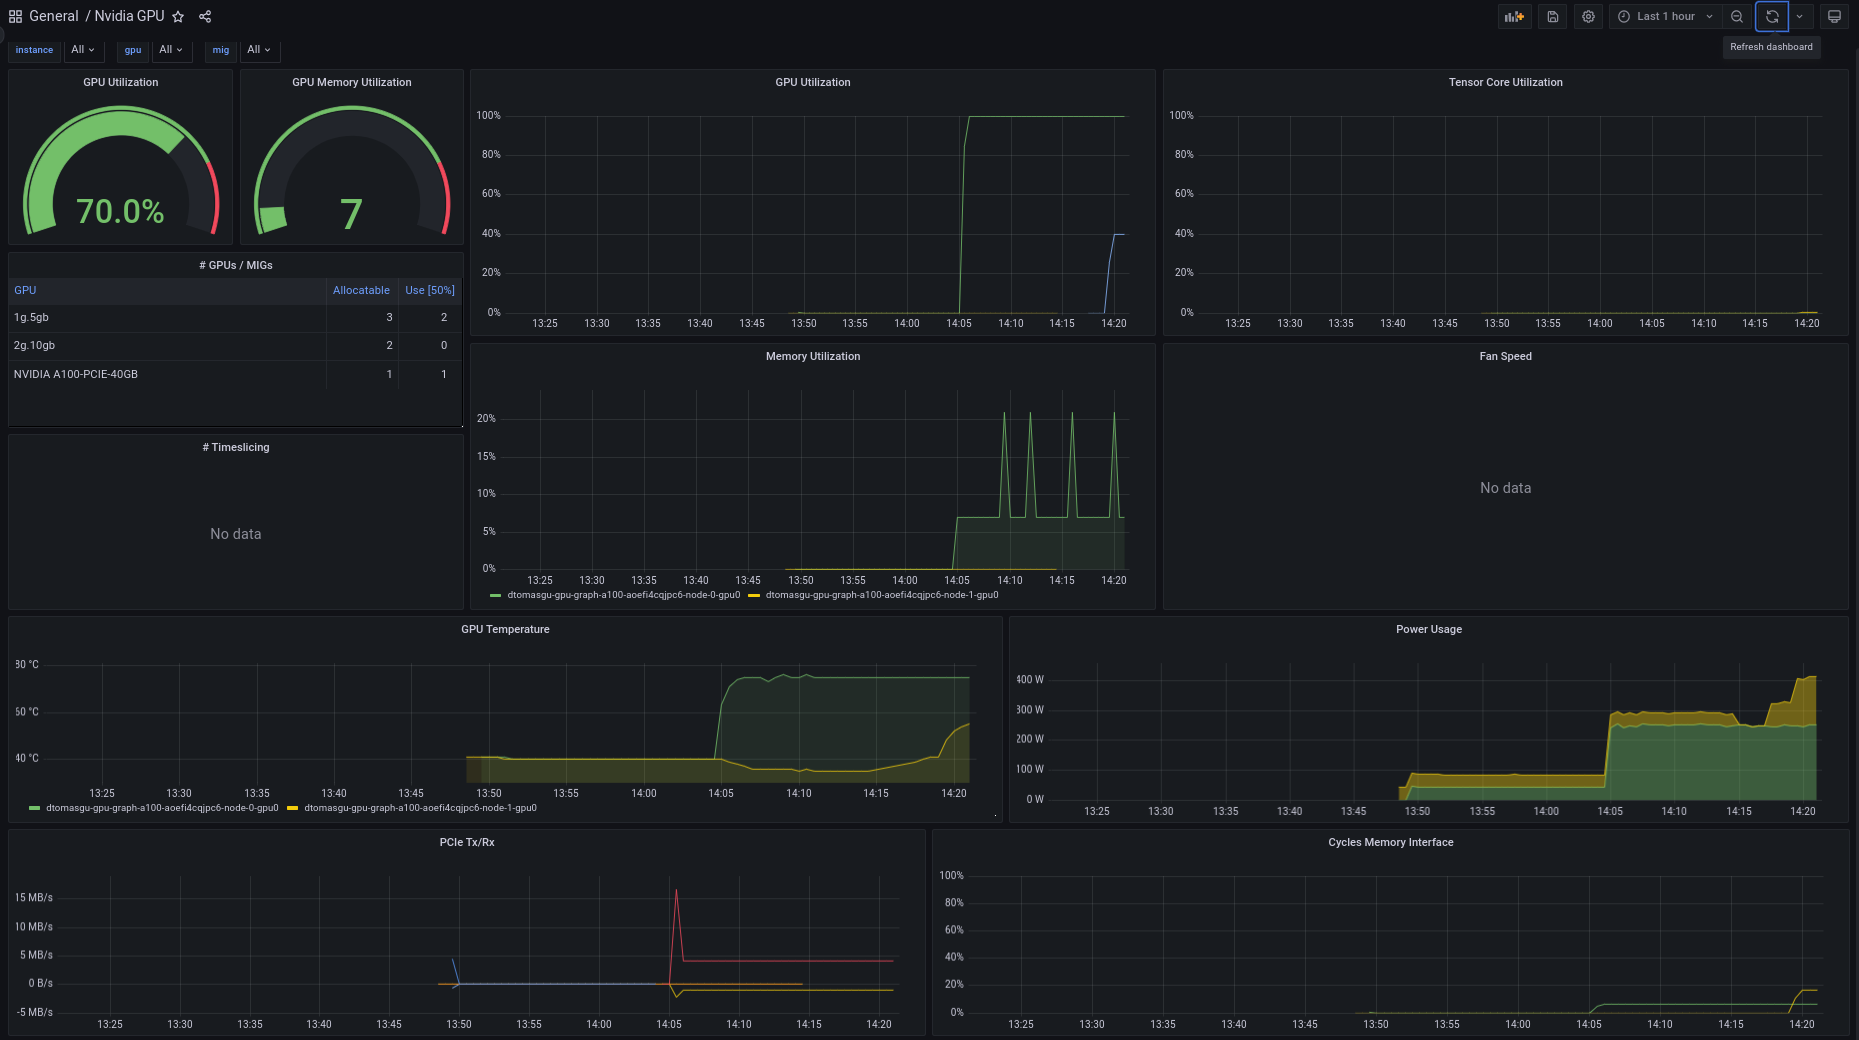
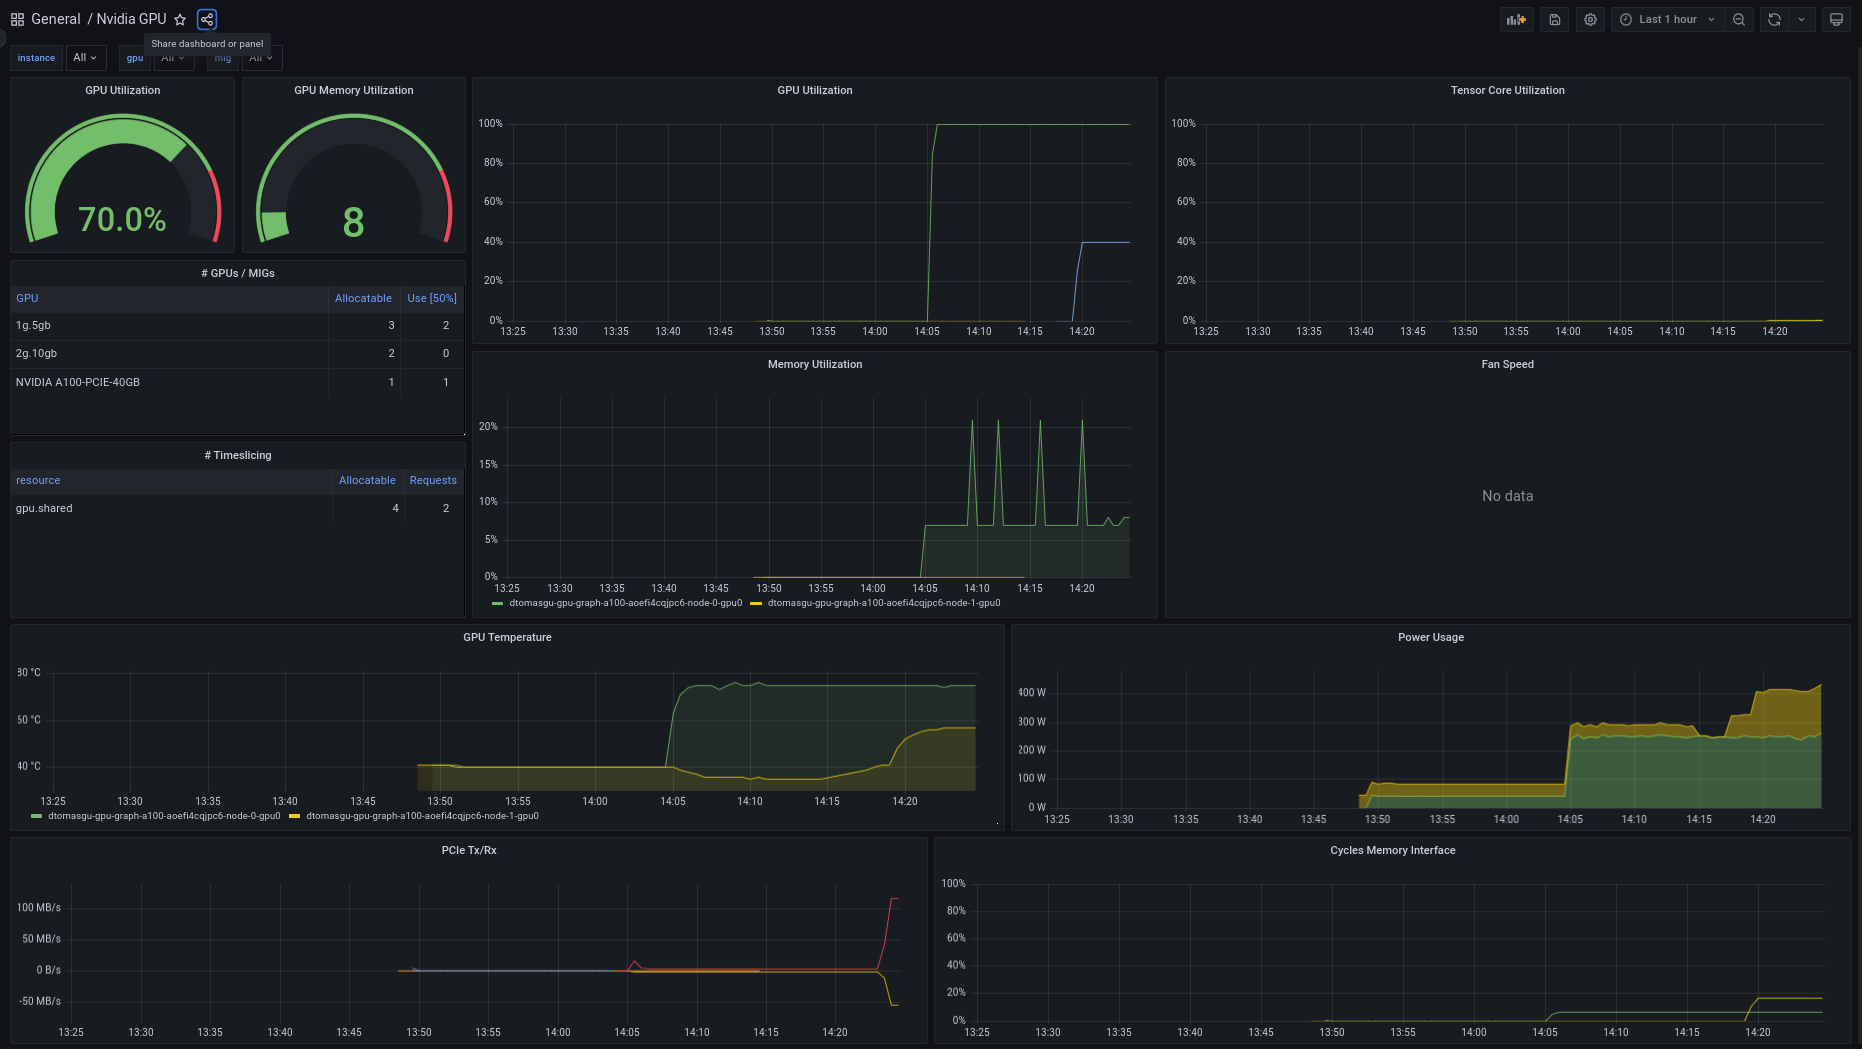
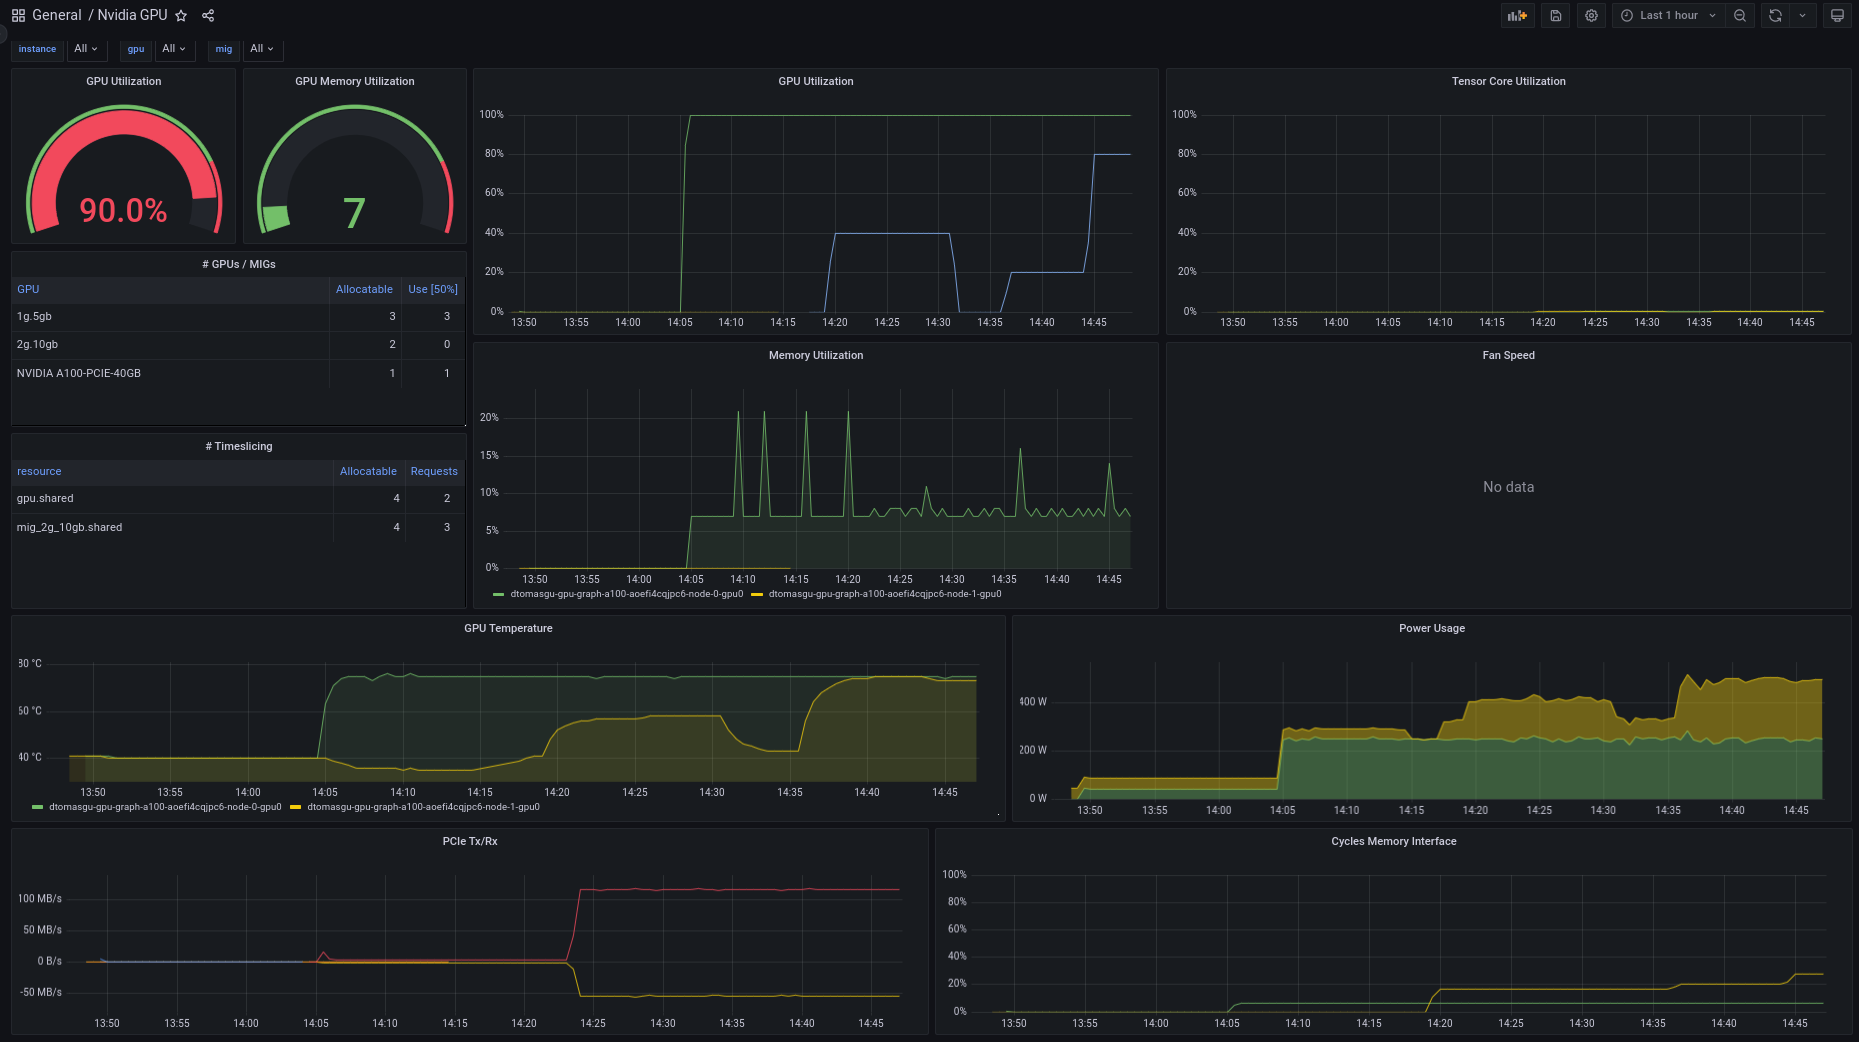
Nvidia GPU
GPU dashboard for nvidia metrics
To be used with the gpu-operator helm chart. Some considerations related to the metrics available:
- Graph GPU utilization does not take into consideration MIG partition size :(
- Table Usage for TimeSliced MIG is not showing usage correctly.
This was tested using NODE wide definitions (no modes or individual cards tested)
Contributions welcome! Send contributions to dy090.guerra@gmail.com
CHANGELOG:
Revision 2
- Correct usage of Memory Metrics (instead of Bandwidth)
- Replacement of the fan speed graph for the SM metrics
- Added Profiling metrics for FP64, FP32 and FP16 together with Tensor core
The added/refactored metrics require the usage of a custom dcgmExporter configMap that exports the following metrics in addition to defaults:
- DCGM_FI_PROF_PIPE_FP64_ACTIVE
- DCGM_FI_PROF_PIPE_FP32_ACTIVE
- DCGM_FI_PROF_PIPE_FP16_ACTIVE
- DCGM_FI_PROF_SM_ACTIVE
- DCGM_FI_PROF_SM_OCCUPANCY
- DCGM_FI_DEV_FB_TOTAL
NOTE: consider using DCGM_FI_DEV_FB_TOTAL instead of (DCGM_FI_DEV_FB_FREE + DCGM_FI_DEV_FB_USED) in memory dashboards.
Revision 1
First release
Contributors:
- Diana Gaponcic
- Diogo Guerra
Data source config
Collector config:
Upload an updated version of an exported dashboard.json file from Grafana
| Revision | Description | Created | |
|---|---|---|---|
| Download |


