
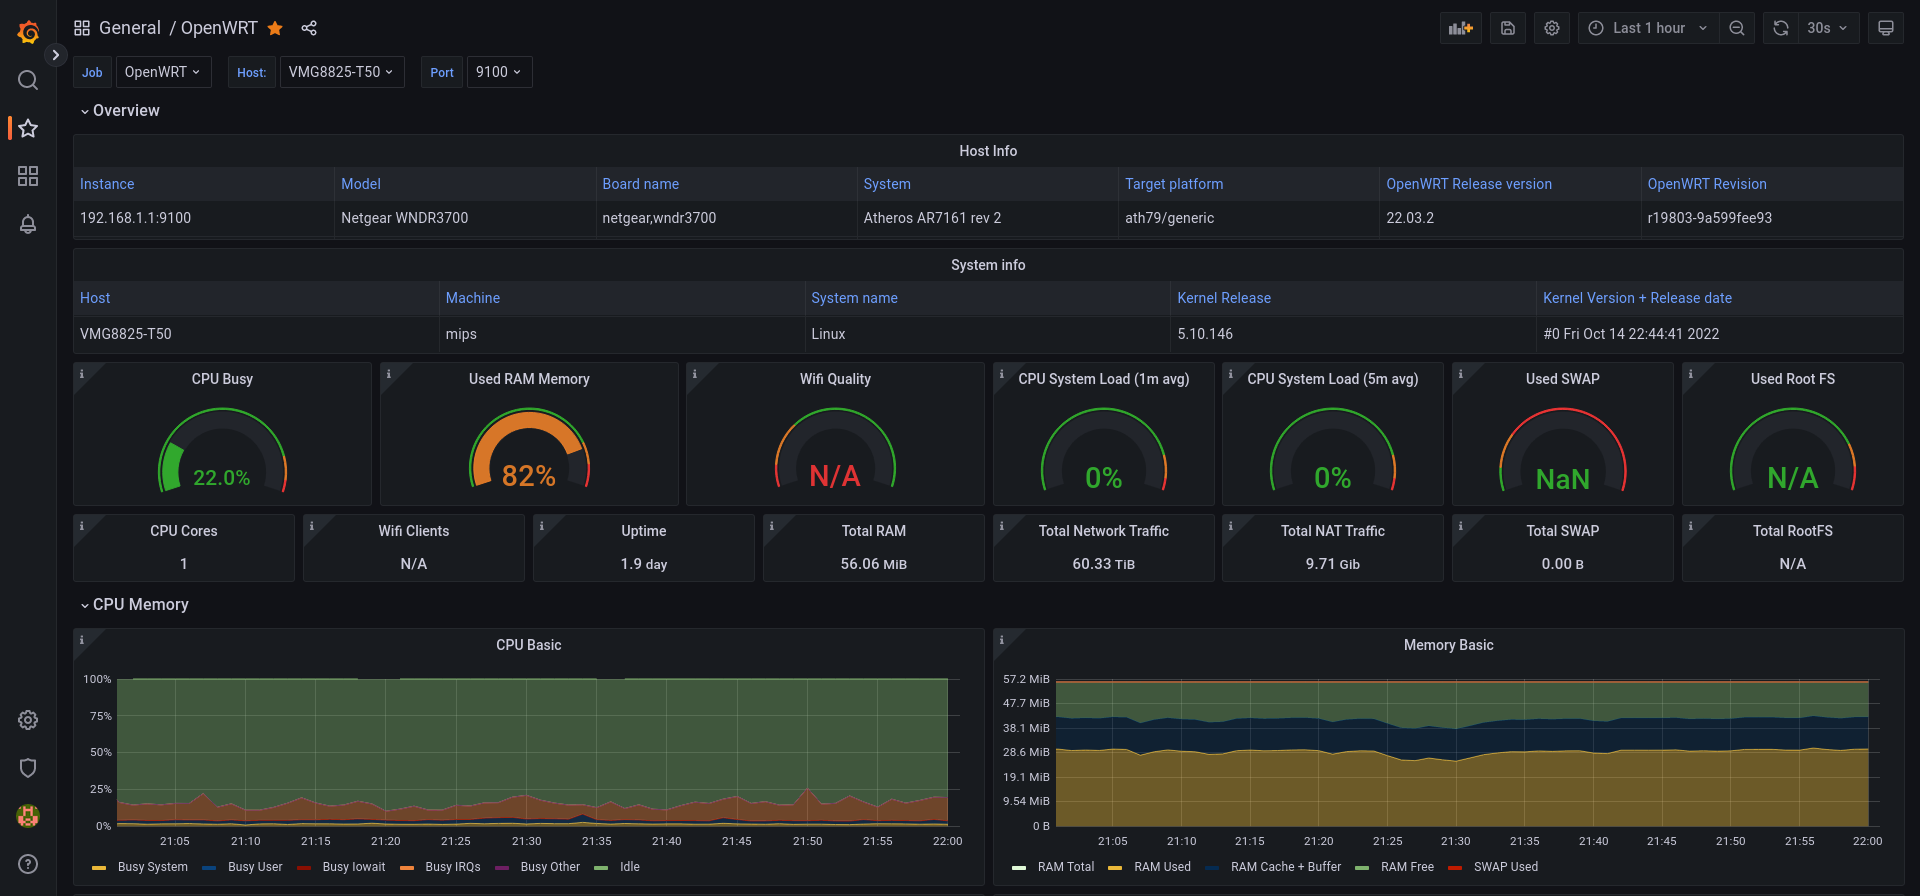
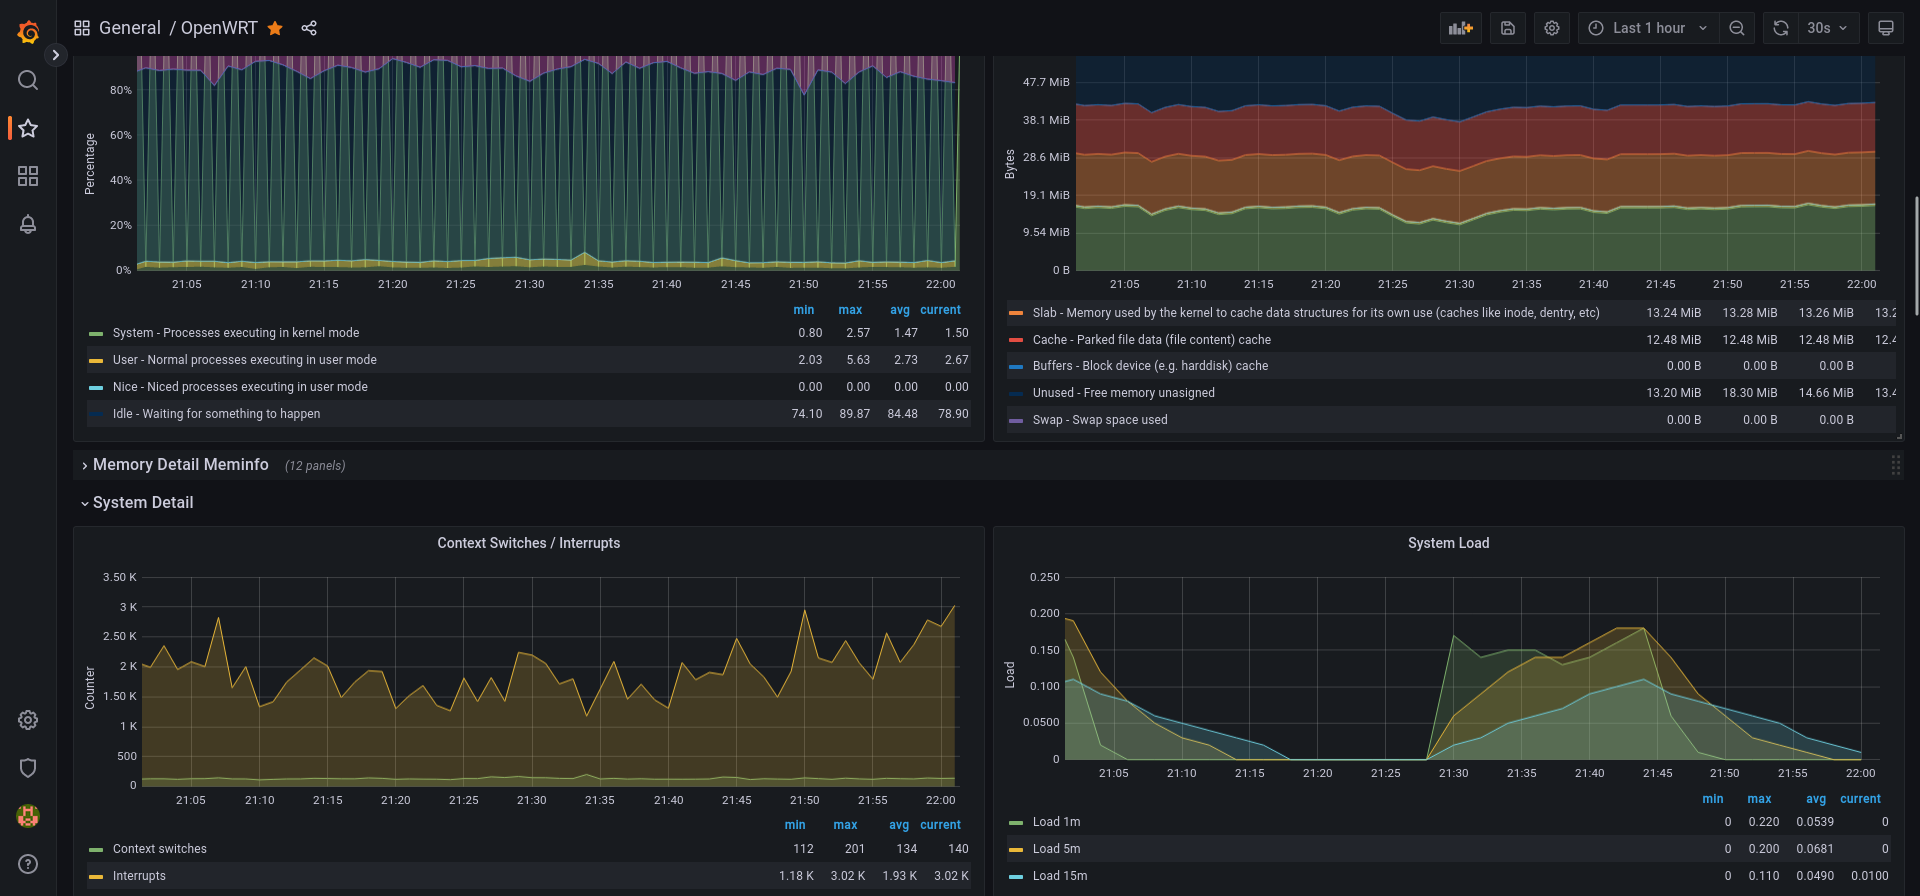
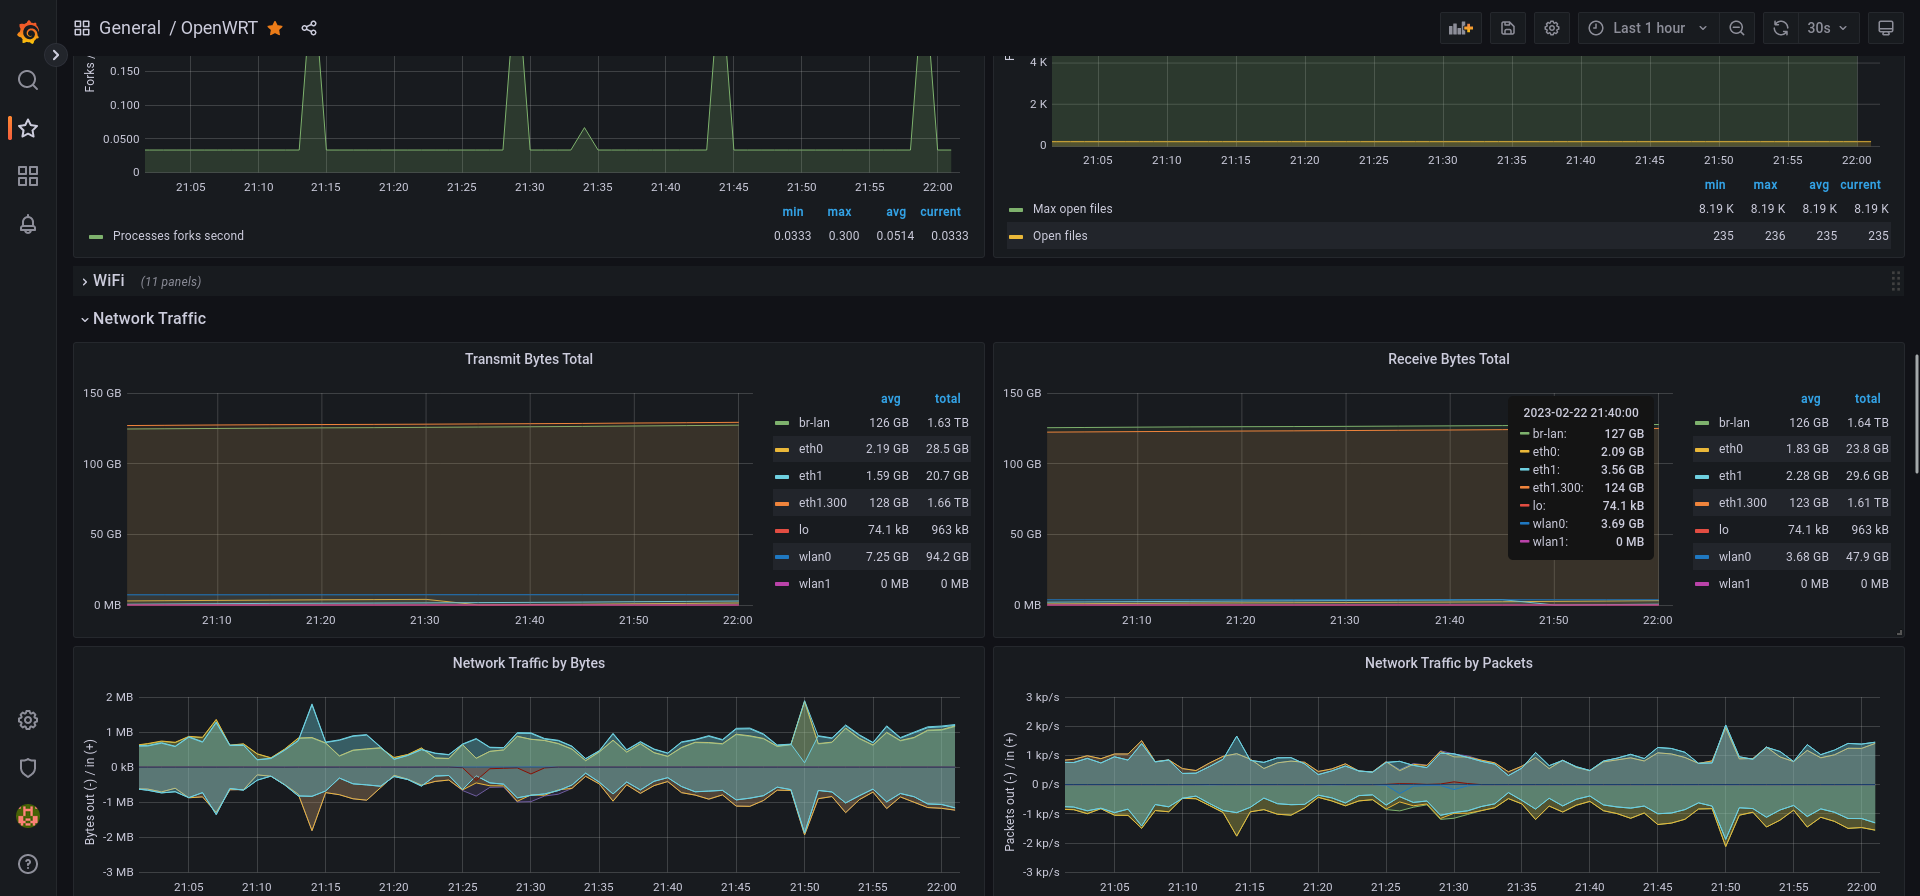
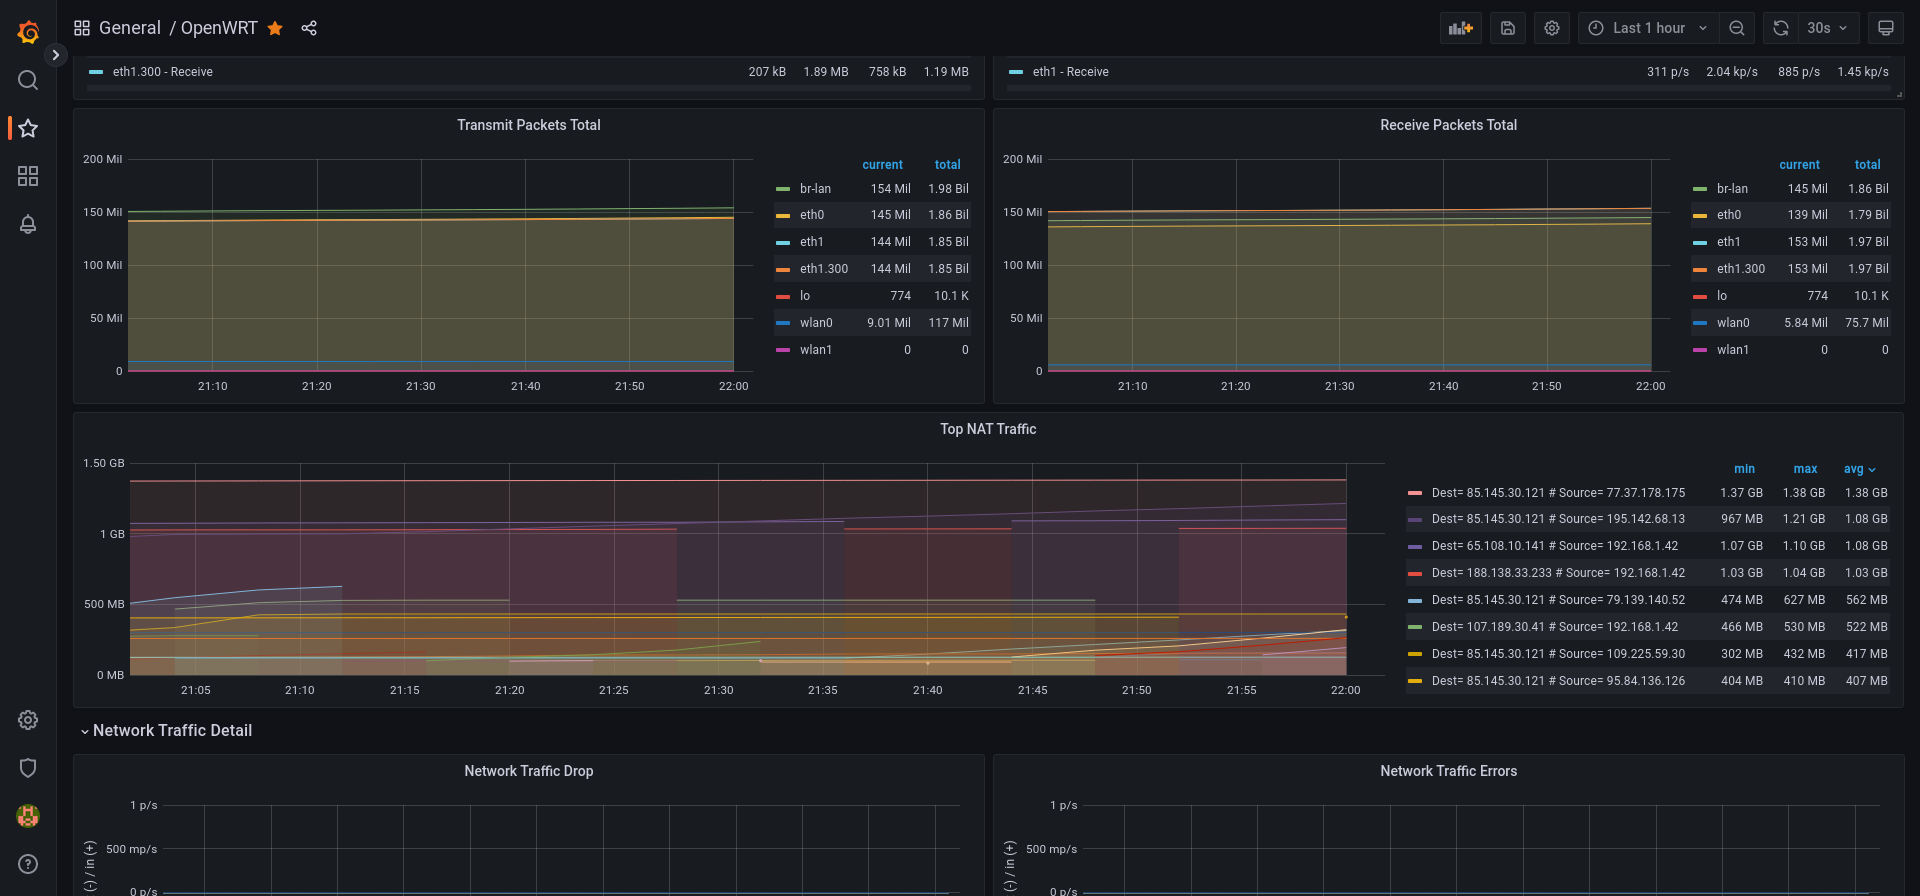
OpenWRT
Dashboard for OpenWRT routers with installed Prometheus lua exporter scripts.
Node Exporter scripts
Install the following packages on your OpenWRT router using opkg install:
prometheus-node-exporter-lua
prometheus-node-exporter-lua-nat_traffic
prometheus-node-exporter-lua-netstat
prometheus-node-exporter-lua-openwrt
prometheus-node-exporter-lua-wifi
prometheus-node-exporter-lua-wifi_stations
Exporter Config
Once you installed the prometheus node exporter Lua scripts, you will need to make the x.x.x.x:9100/metrics end-point available to your routers’ LAN interface, otherwise your Prometheus server can’t fetch the data.
SSH to your OpenWRT router. Edit the following file using vi /etc/config/prometheus-node-exporter-lua. And update/add the last line to the end, of course use the right indentation:
option listen_interface 'lan'
Then restart the exporter: /etc/init.d/prometheus-node-exporter-lua restart
Prometheus Config
In Prometheus you need to add a new job scrape config (at the end of the file) /etc/prometheus/prometheus.yml, assuming your router is at 192.168.1.1:
- job_name: "OpenWRT"
  static_configs:
    - targets: ["192.168.1.1:9100"]
As you can see no need to add “/metrics” to the end of the URL, /metrics is the default end point that Prometheus will use. Just provide the IP address with the port number.
Data source config
Collector config:
Dashboard revisions
Upload an updated version of an exported dashboard.json file from Grafana
| Revision | Decscription | Created | |
|---|---|---|---|
| Download |
Get this dashboard
Data source:
Dependencies: