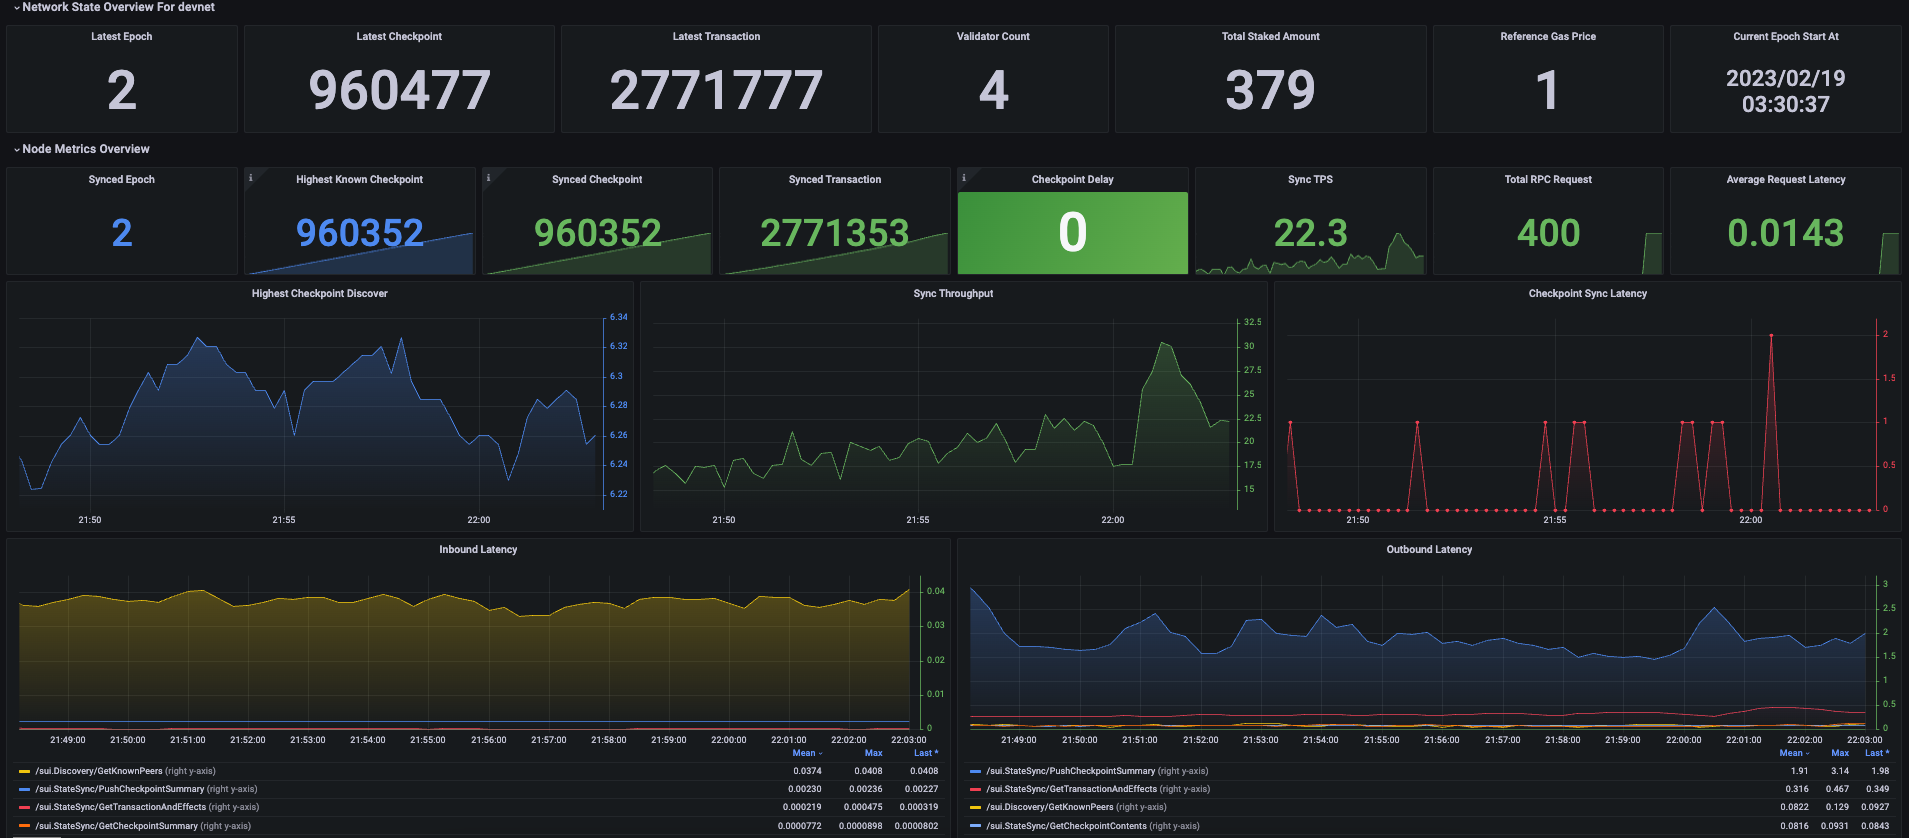
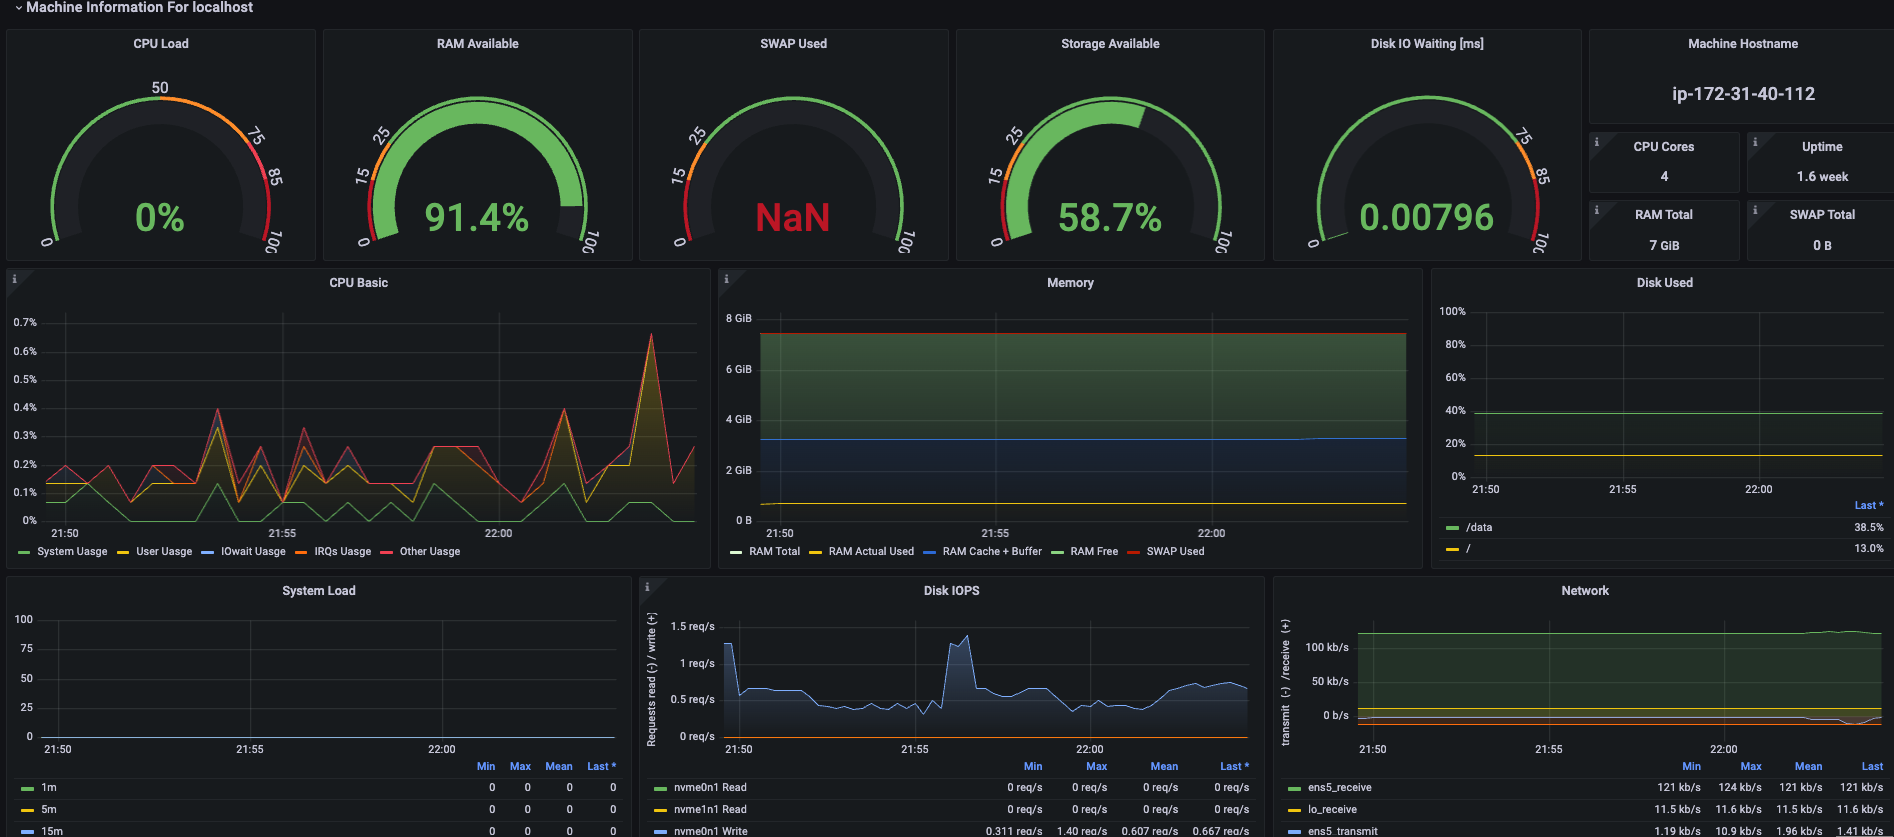
SUI Fullnode Monitor Dashboard
the monitor dashboard for SUI fullnode
Overview
This is a work-in-progress Grafana dashboard for monitoring SUI fullnode. Setting up Prometheus / Grafana is outside the scope of this cookbook.
Something you need to do in advance
- Install
node-exporterservice. get it from github or just runapt install prometheus-node-exporter - Setup your
prometheus.ymlfile like this:
- job_name: sui
    static_configs:
    # for sui node metrics
	- targets: ['localhost:9184']
	  labels:
	  chain: 'devnet' # or testnet
	# for machine metrics
	- targets: ['localhost:9100']
	  labels:
	  chain: 'devnet' # or testnet
- Install Infinity Plugin for Grafana. Install it by run
grafana-cli plugins install yesoreyeram-infinity-datasourcecommand on the grafana server, or from grafana.net cloud installs. after you finish install, go to your datasources and add a new datasource. choose type Infinity and hit save without any other configuration.
Then enjoy it :)
Data source config
Collector type:
Collector plugins:
Collector config:
Revisions
Upload an updated version of an exported dashboard.json file from Grafana
| Revision | Description | Created | |
|---|---|---|---|
| Download |