Redpanda Ops Dashboard
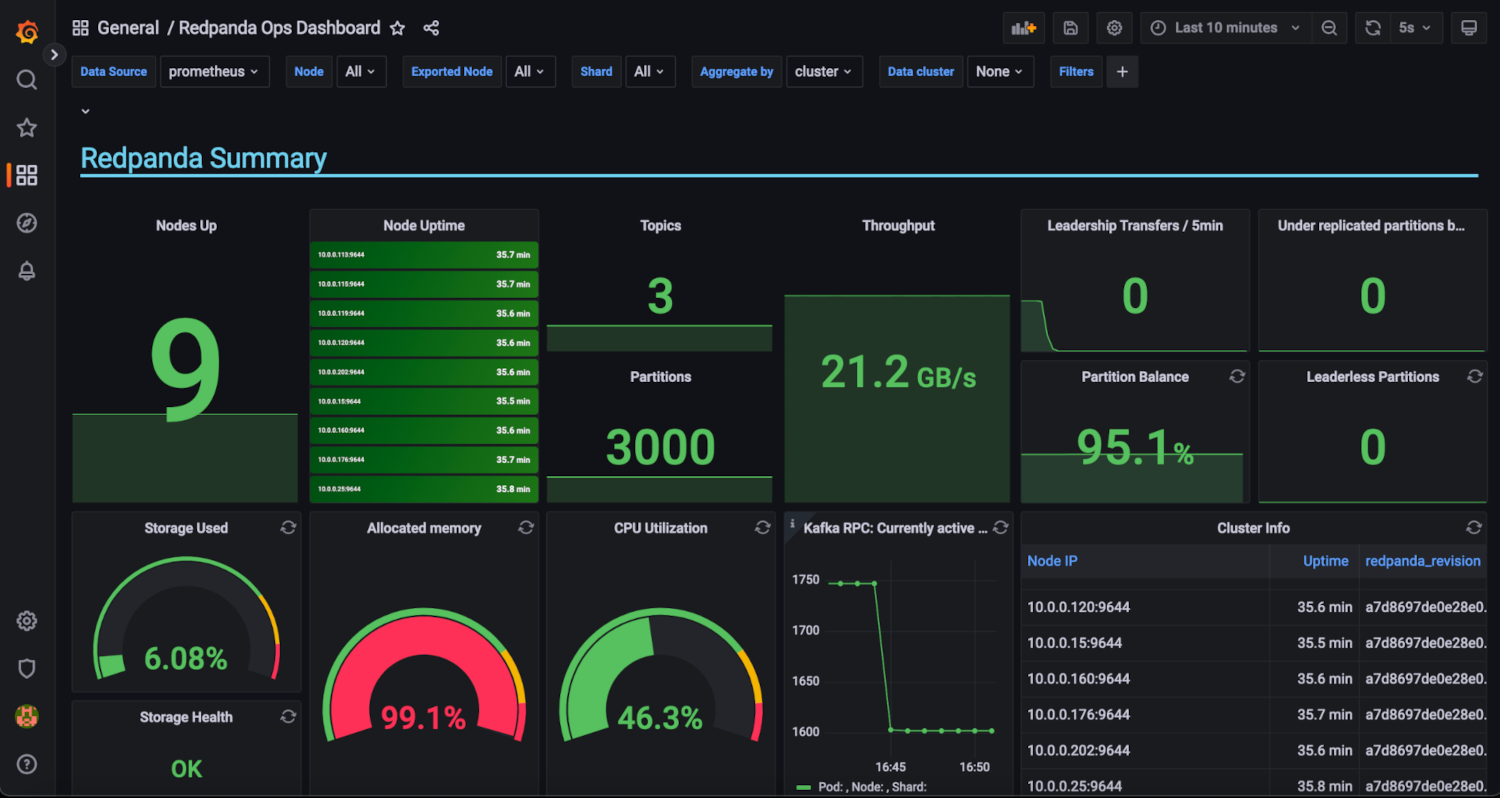
A dashboard focused on Redpanda operations, with the following charts:
- nodes up (count)
- node uptime
- topics (count)
- partitions (count)
- throughput (total)
- leadership transfers per 5min
- partition balance (percentage)
- under-replicated partitions (count)
- leaderless partitions (count)
- storage used (percentage)
- storage health
- allocated memory (total, percentage)
- CPU utilization (total, percentage)
- Kafka RPC
- cluster info
Data source config
Collector type:
Collector plugins:
Collector config:
Revisions
Upload an updated version of an exported dashboard.json file from Grafana
| Revision | Description | Created | |
|---|---|---|---|
| Download |