
Kafka Consumer
Kafka Consumer Java client metrics for Redpanda
This dashboard requires a JMX agent reporting statistics from a Kafka Java consumer into Prometheus.
⚠️ This dashboard has some sample thresholds, this example is not meant to fit all use cases nor is it meant for production. Think of it as a learning tool to help you become comfortable with the metrics and thresholding.
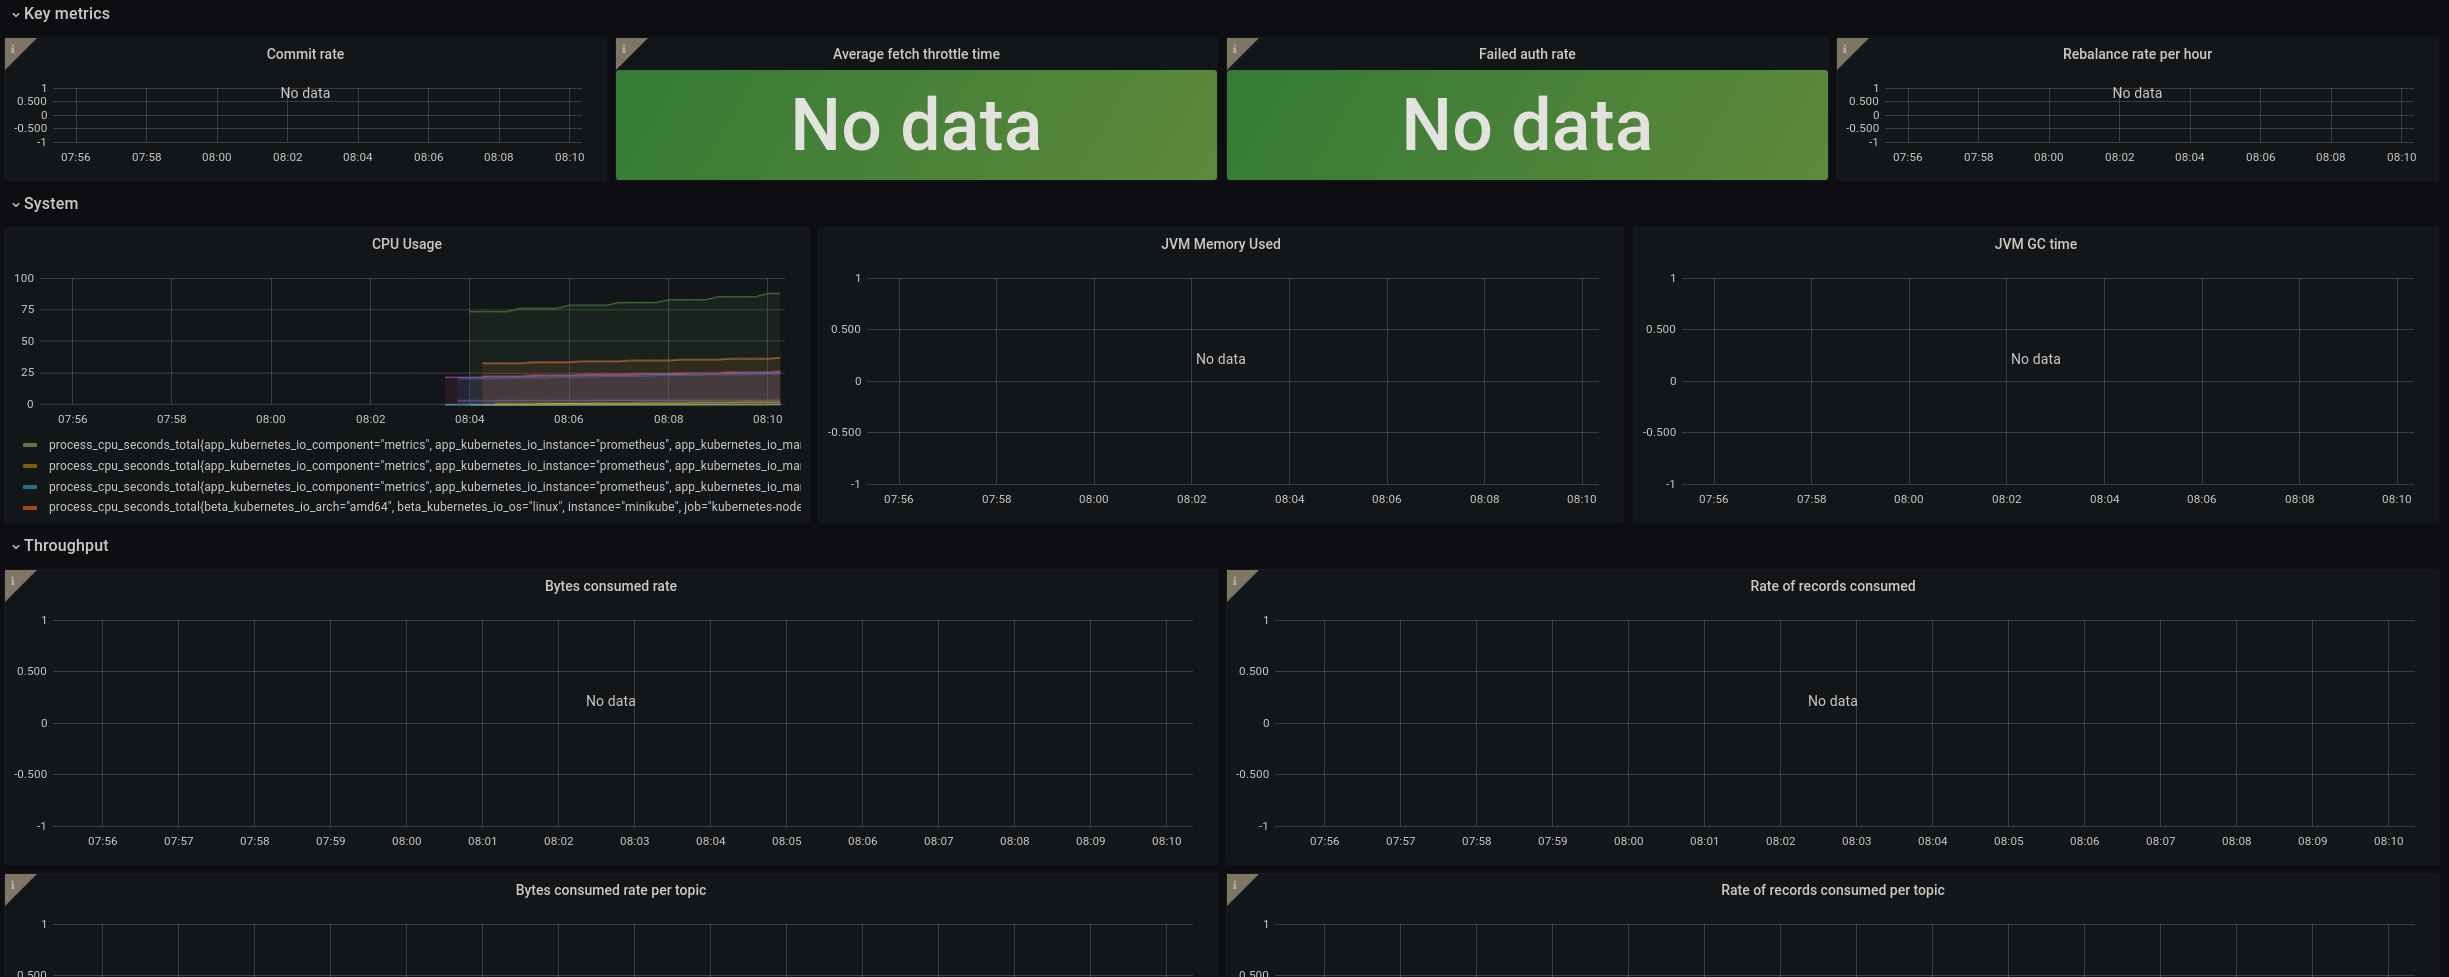
This dashboard focuses on consumers, and it has the following charts:
- commit rate
- average fetch throttle time
- failed auth rate
- rebalance rate per hour
- CPU usage
- JVM memory used
- JVM GC time
- bytes consumed rate
- rate of records consumed
- bytes consumed rate per topic
- rate of records consumed per topic
- fetch request rate
- fetch size average
- fetch latency average
- commit latency average
- commit rate
- current connection count
- node response rate
Data source config
Collector type:
Collector plugins:
Collector config:
Dashboard revisions
Upload an updated version of an exported dashboard.json file from Grafana
| Revision | Decscription | Created | |
|---|---|---|---|
| Download |
Sign up for Grafana Cloud

Get up and running in minutes with the Grafana Cloud free tier, which includes free forever 10k metrics, 50GB logs, 50GB traces, 500 VUh, and more.
Get this dashboard
Data source:
Dependencies: