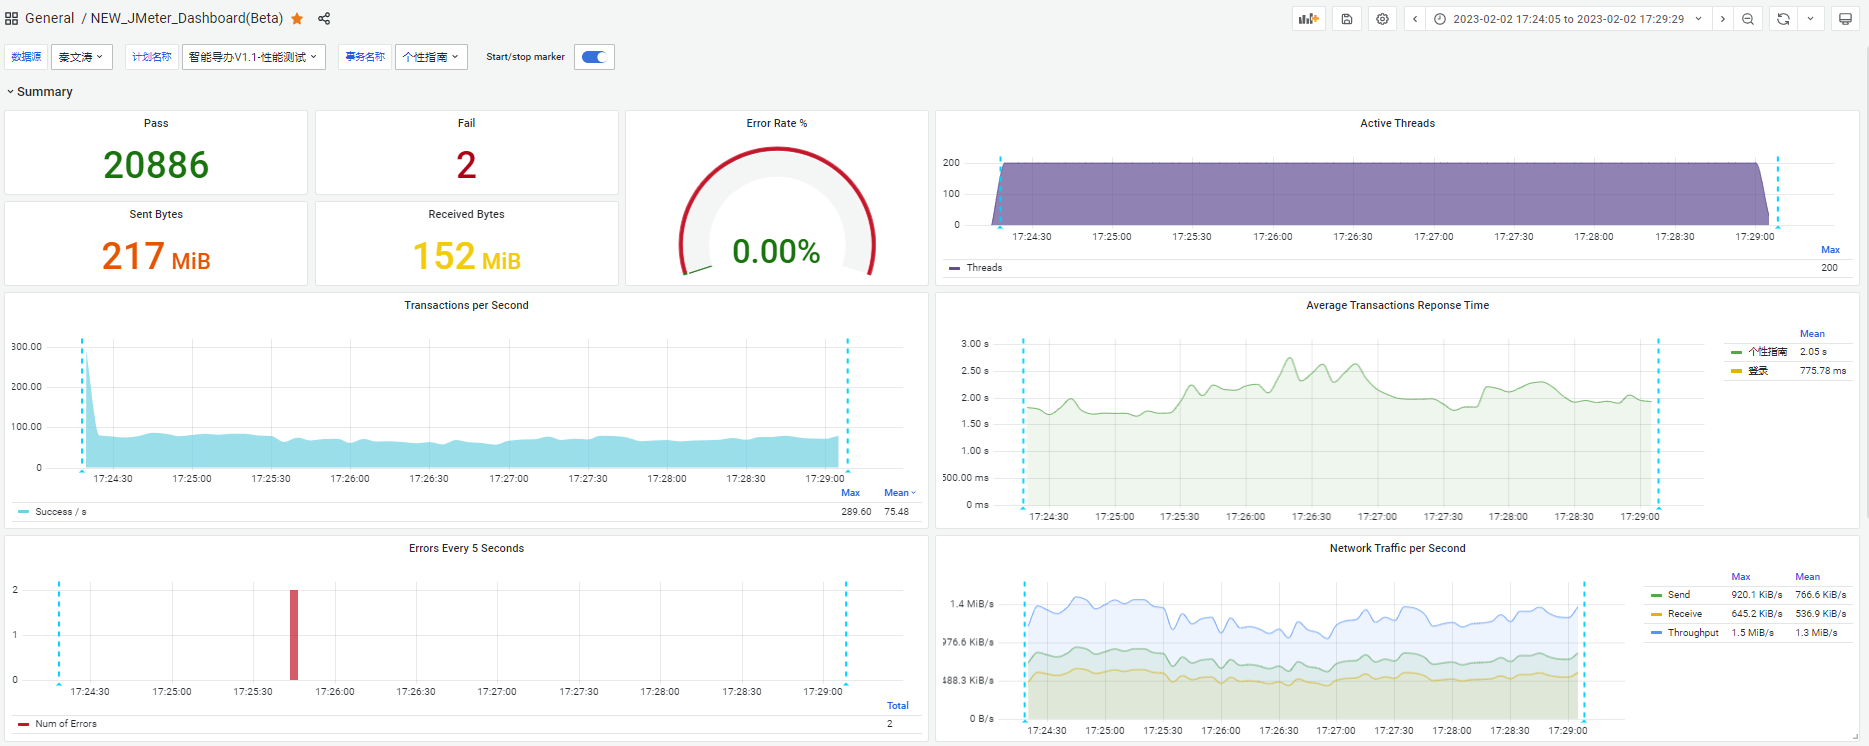
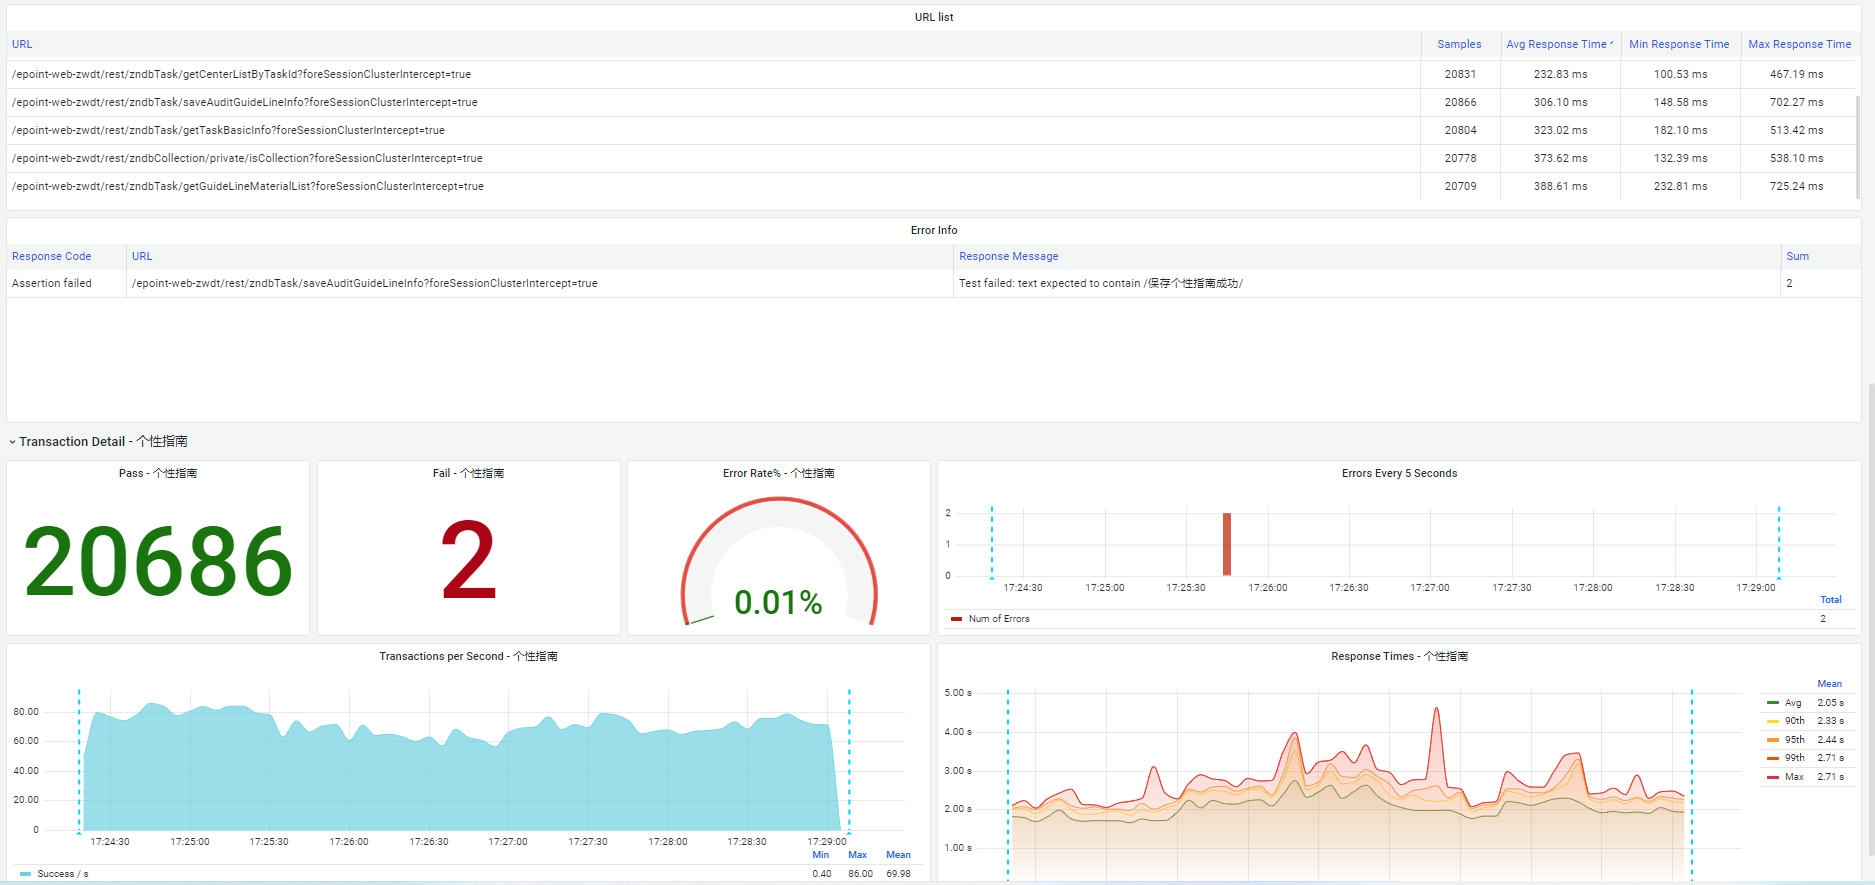
JMeter_Dashboard_By_Epoint
完美的JMeter性能测试统计面板。
- Grafana 数据源选择influxdb
- 压测时,在脚本中添加后端监听器,并做如下修改:
- 后端监听器实现选择org.apache.jmeter.visualizer.backend.influxdb.InfluxdbBackendListenerClient
- influxdburl中host_to_change修改为你安装influxdb的服务器ip
- summaryOnly参数修改为false
- 将要压测的http请求加入事务控制器中,事务控制器命名时不要包含"/",否则summary中的数据将显示为空
Data source config
Collector type:
Collector plugins:
Collector config:
Revisions
Upload an updated version of an exported dashboard.json file from Grafana
| Revision | Description | Created | |
|---|---|---|---|
| Download |