Grafana Dashboard for Veeam ONE Audit Events
Grafana Dashboard for Veeam ONE Audit Events (v12 and above)
This Dashboard works natively by using telegraf and the win_eventlog plugin, use the configuration that you can find under the collector config, restart telegraf, and that's it.
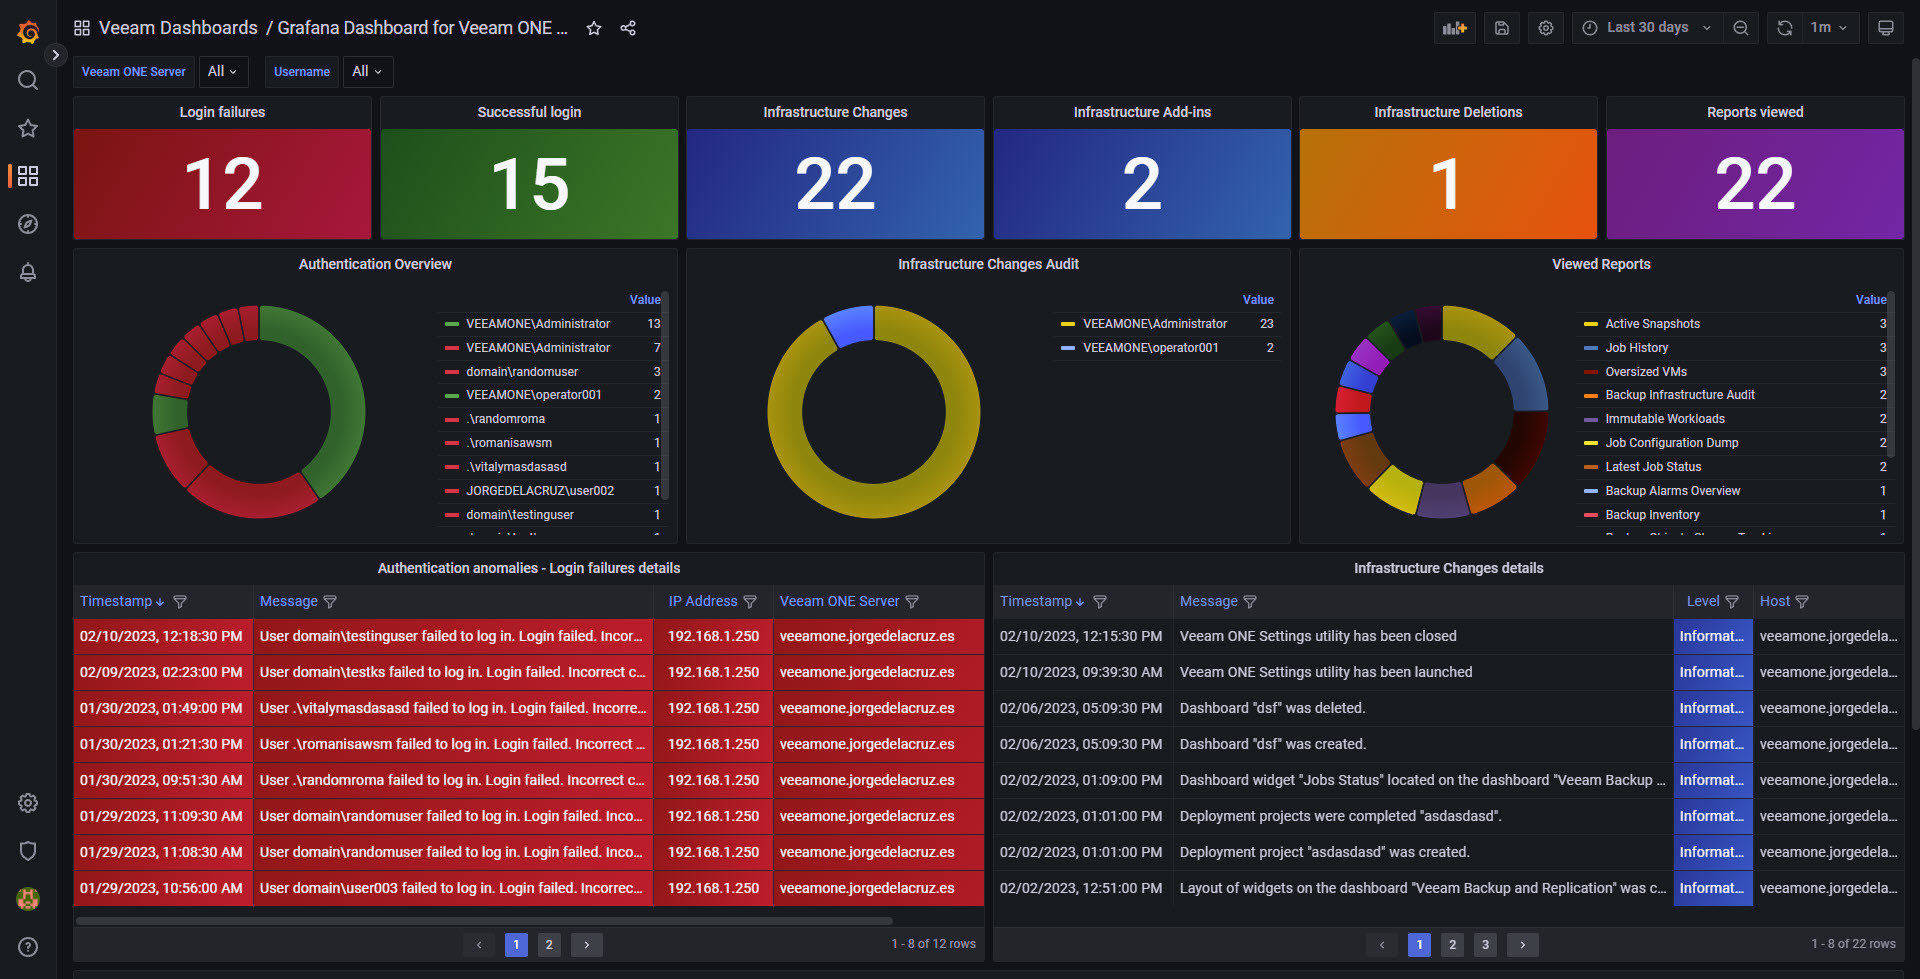
The Dashboard will highlight the most concerning areas, like Infrastructure edits, failed logins to both Web Client, and Windows Client, Most popular Reports, etc.
Then download or import this Dashboard to your Grafana, and you should see something similar to the next:
Dark theme

Light theme

Data source config
Collector type:
Collector plugins:
Collector config:
Revisions
Upload an updated version of an exported dashboard.json file from Grafana
| Revision | Description | Created | |
|---|---|---|---|
| Download |