ITSM-NG complete dashboard
A full featured dashboard to perform reporting on ITSM-NG.
![]()
ITSM-NG is a GLPI fork with the objective of offering a strong community component and relevant technological choices.
Some Links
Setup Grafana dashboard
To install and configure ITSM-NG Grafana dashboard, please refer to our documentation : Grafana dashboard.
Report list
The default provided dashboard contains three different type of reporting :
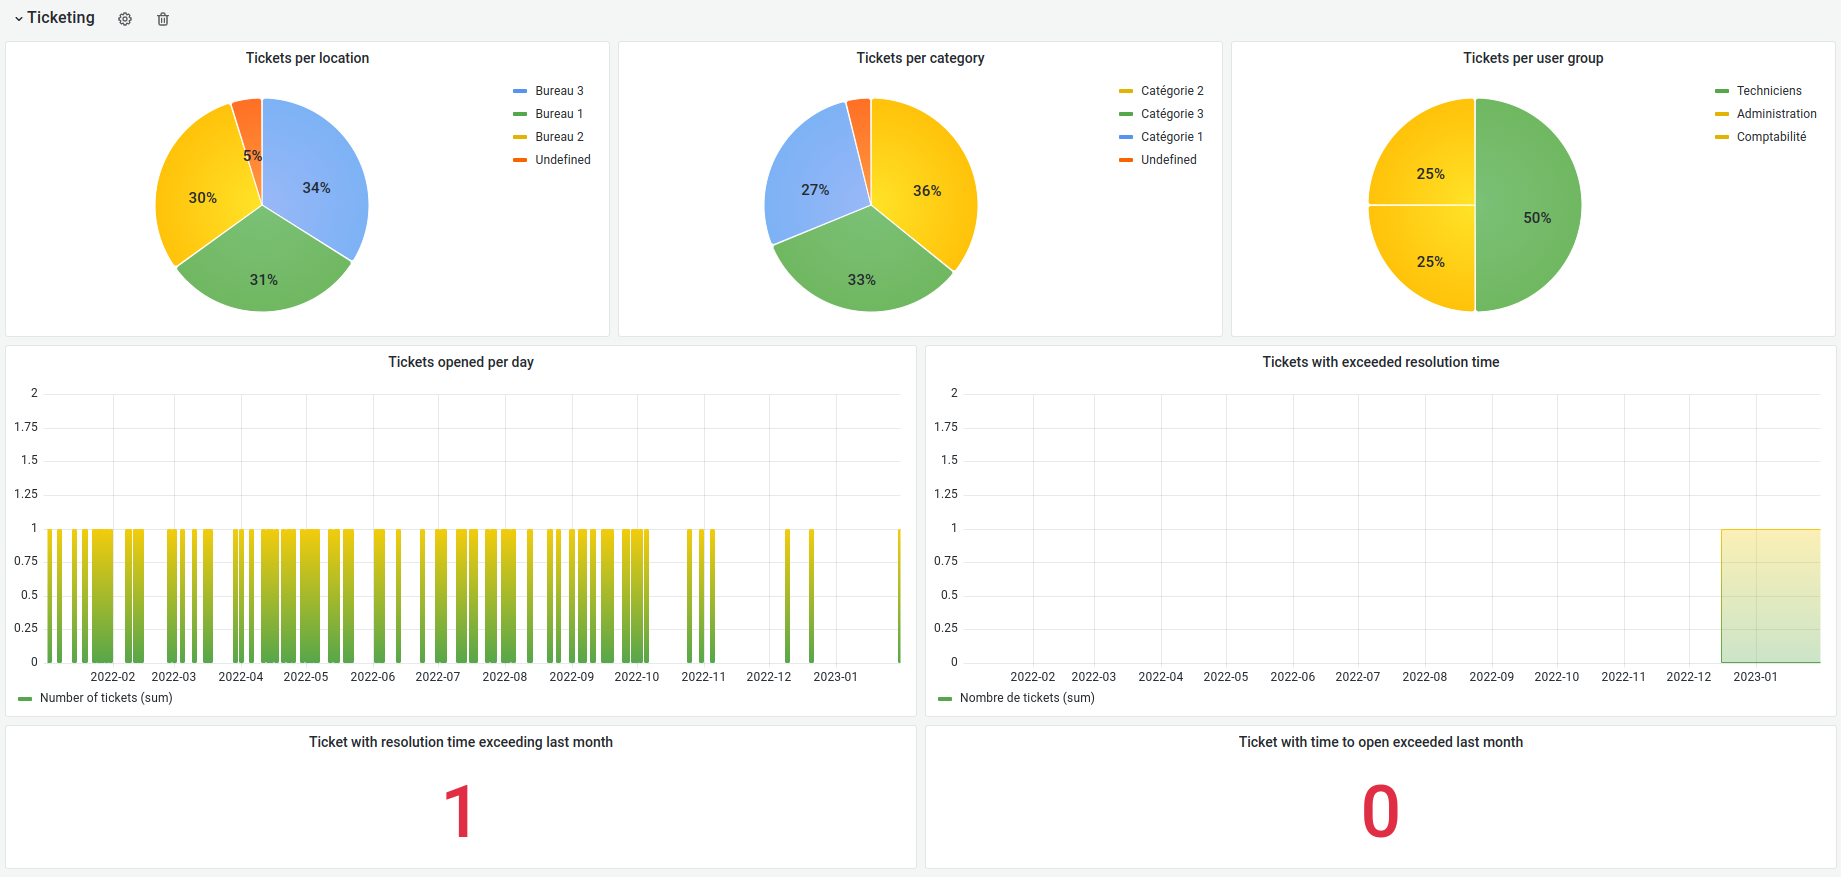
- Ticketing
- Tickets opened per day
- Tickets per location / category / user group
- Tickets with exceeded resolution time
- Tickets with exceeded resolution time last month
- Tickets with time to open exceeded last month

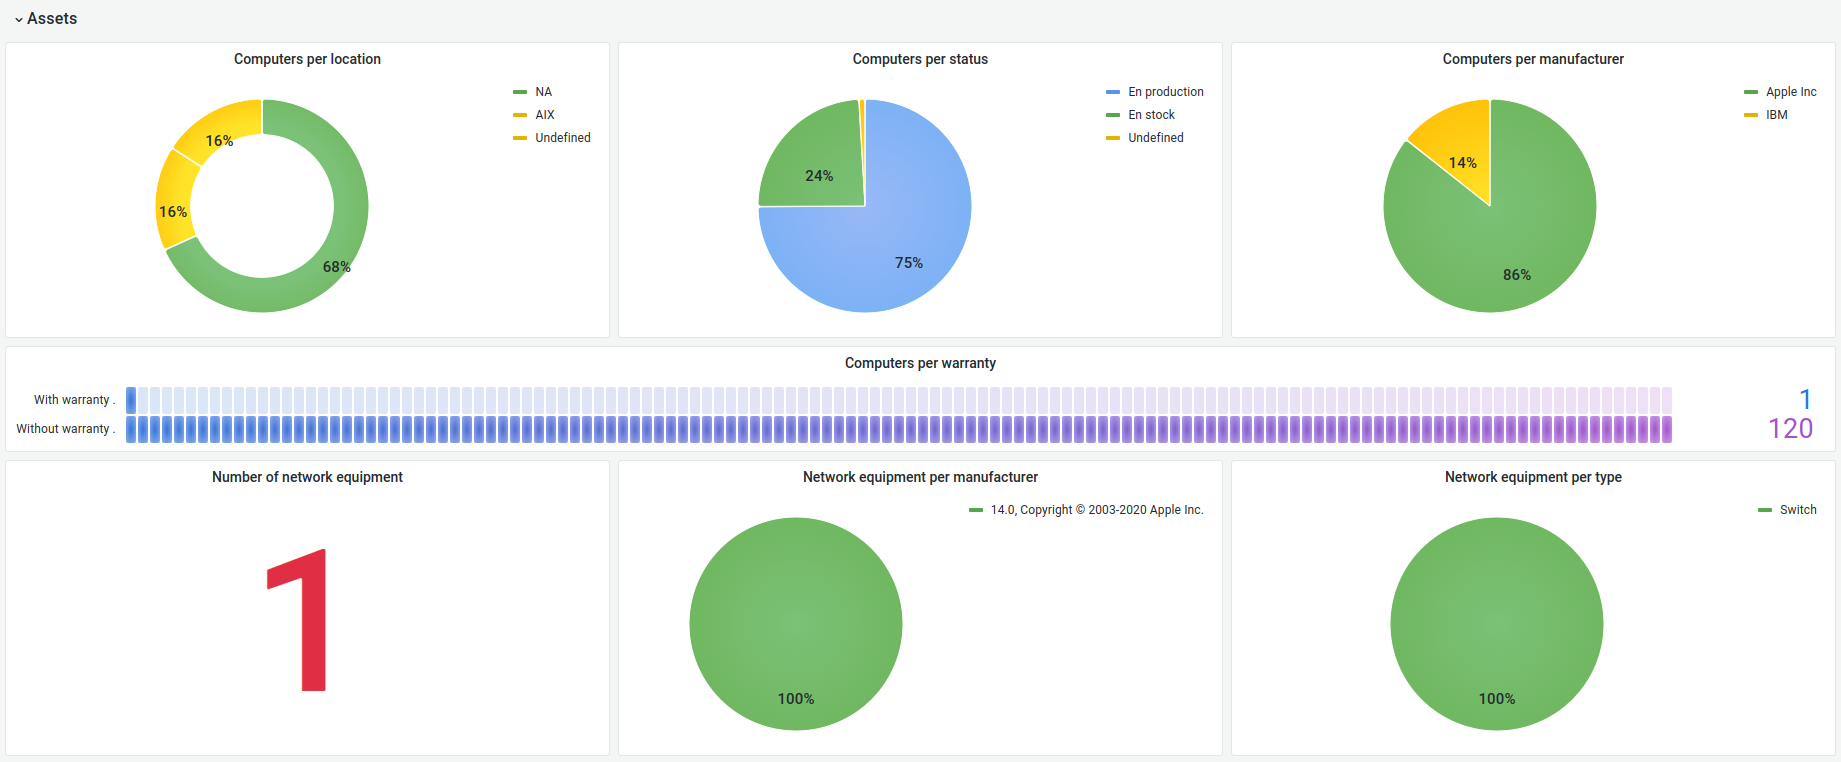
- Assets
- Computers per location / status / warranty / manufacturer
- Network equipment per type / manufacturer
- Number of network equipment

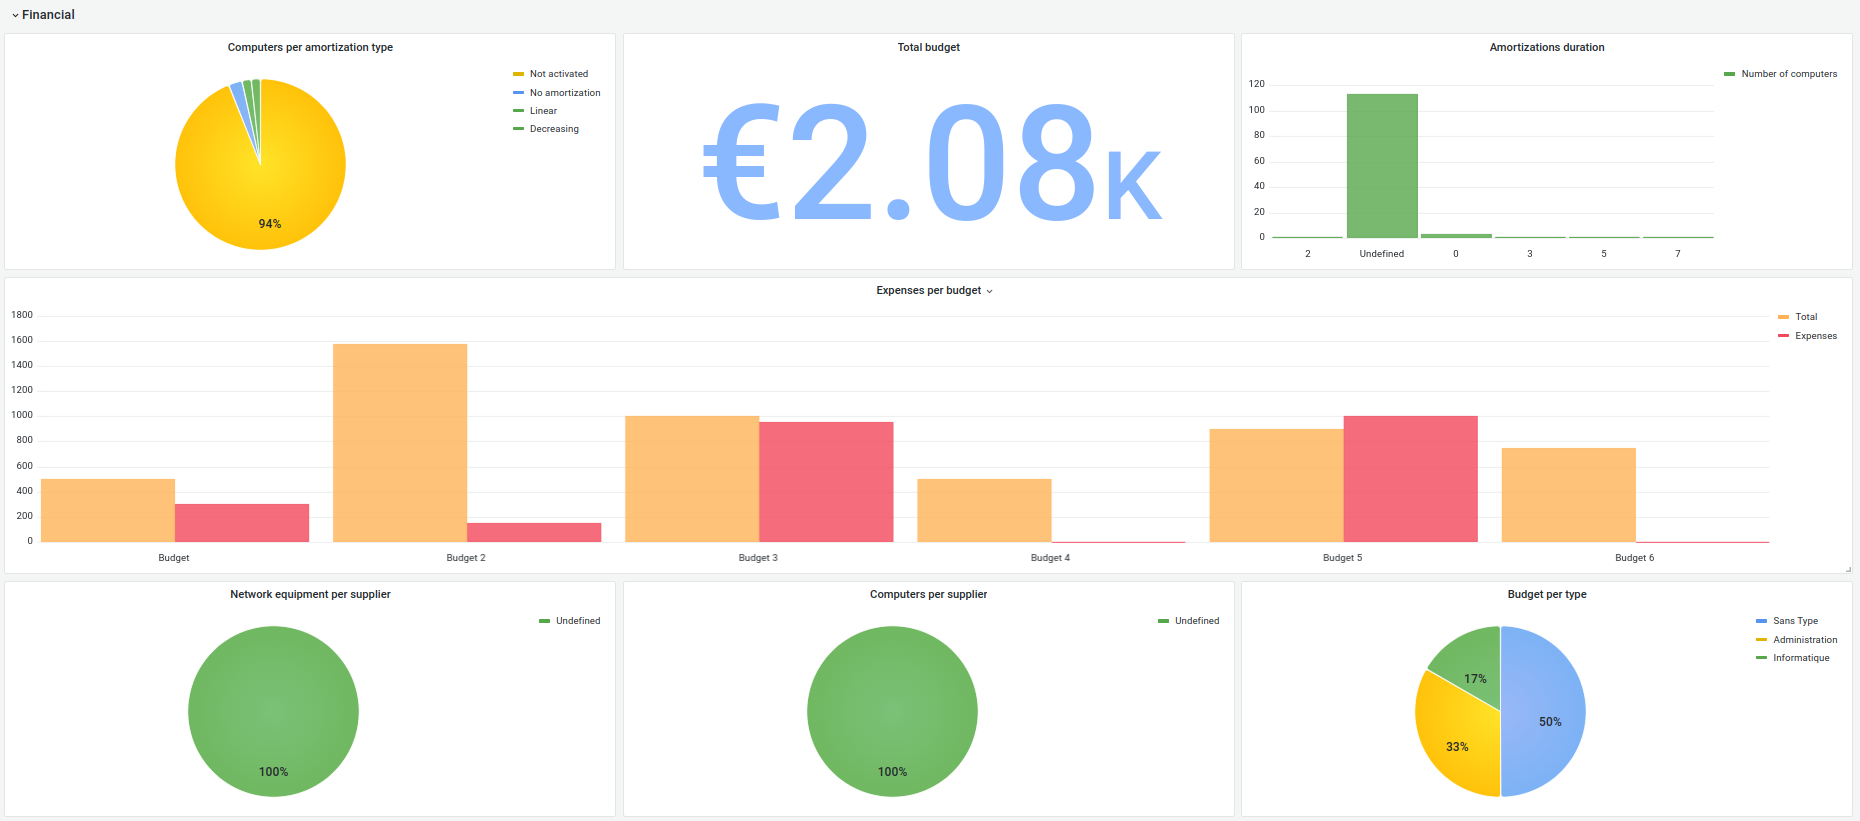
- Financial
- Total budget
- Budget per type
- Expenses per budget
- Amortizations duration
- Computers per supplier / amortization type
- Network equipment per supplier

Data source config
Collector type:
Collector plugins:
Collector config:
Revisions
Upload an updated version of an exported dashboard.json file from Grafana
| Revision | Description | Created | |
|---|---|---|---|
| Download |