k6 Prometheus (Native Histograms)
Visualize k6 OSS results stored in Prometheus with Native Histograms.
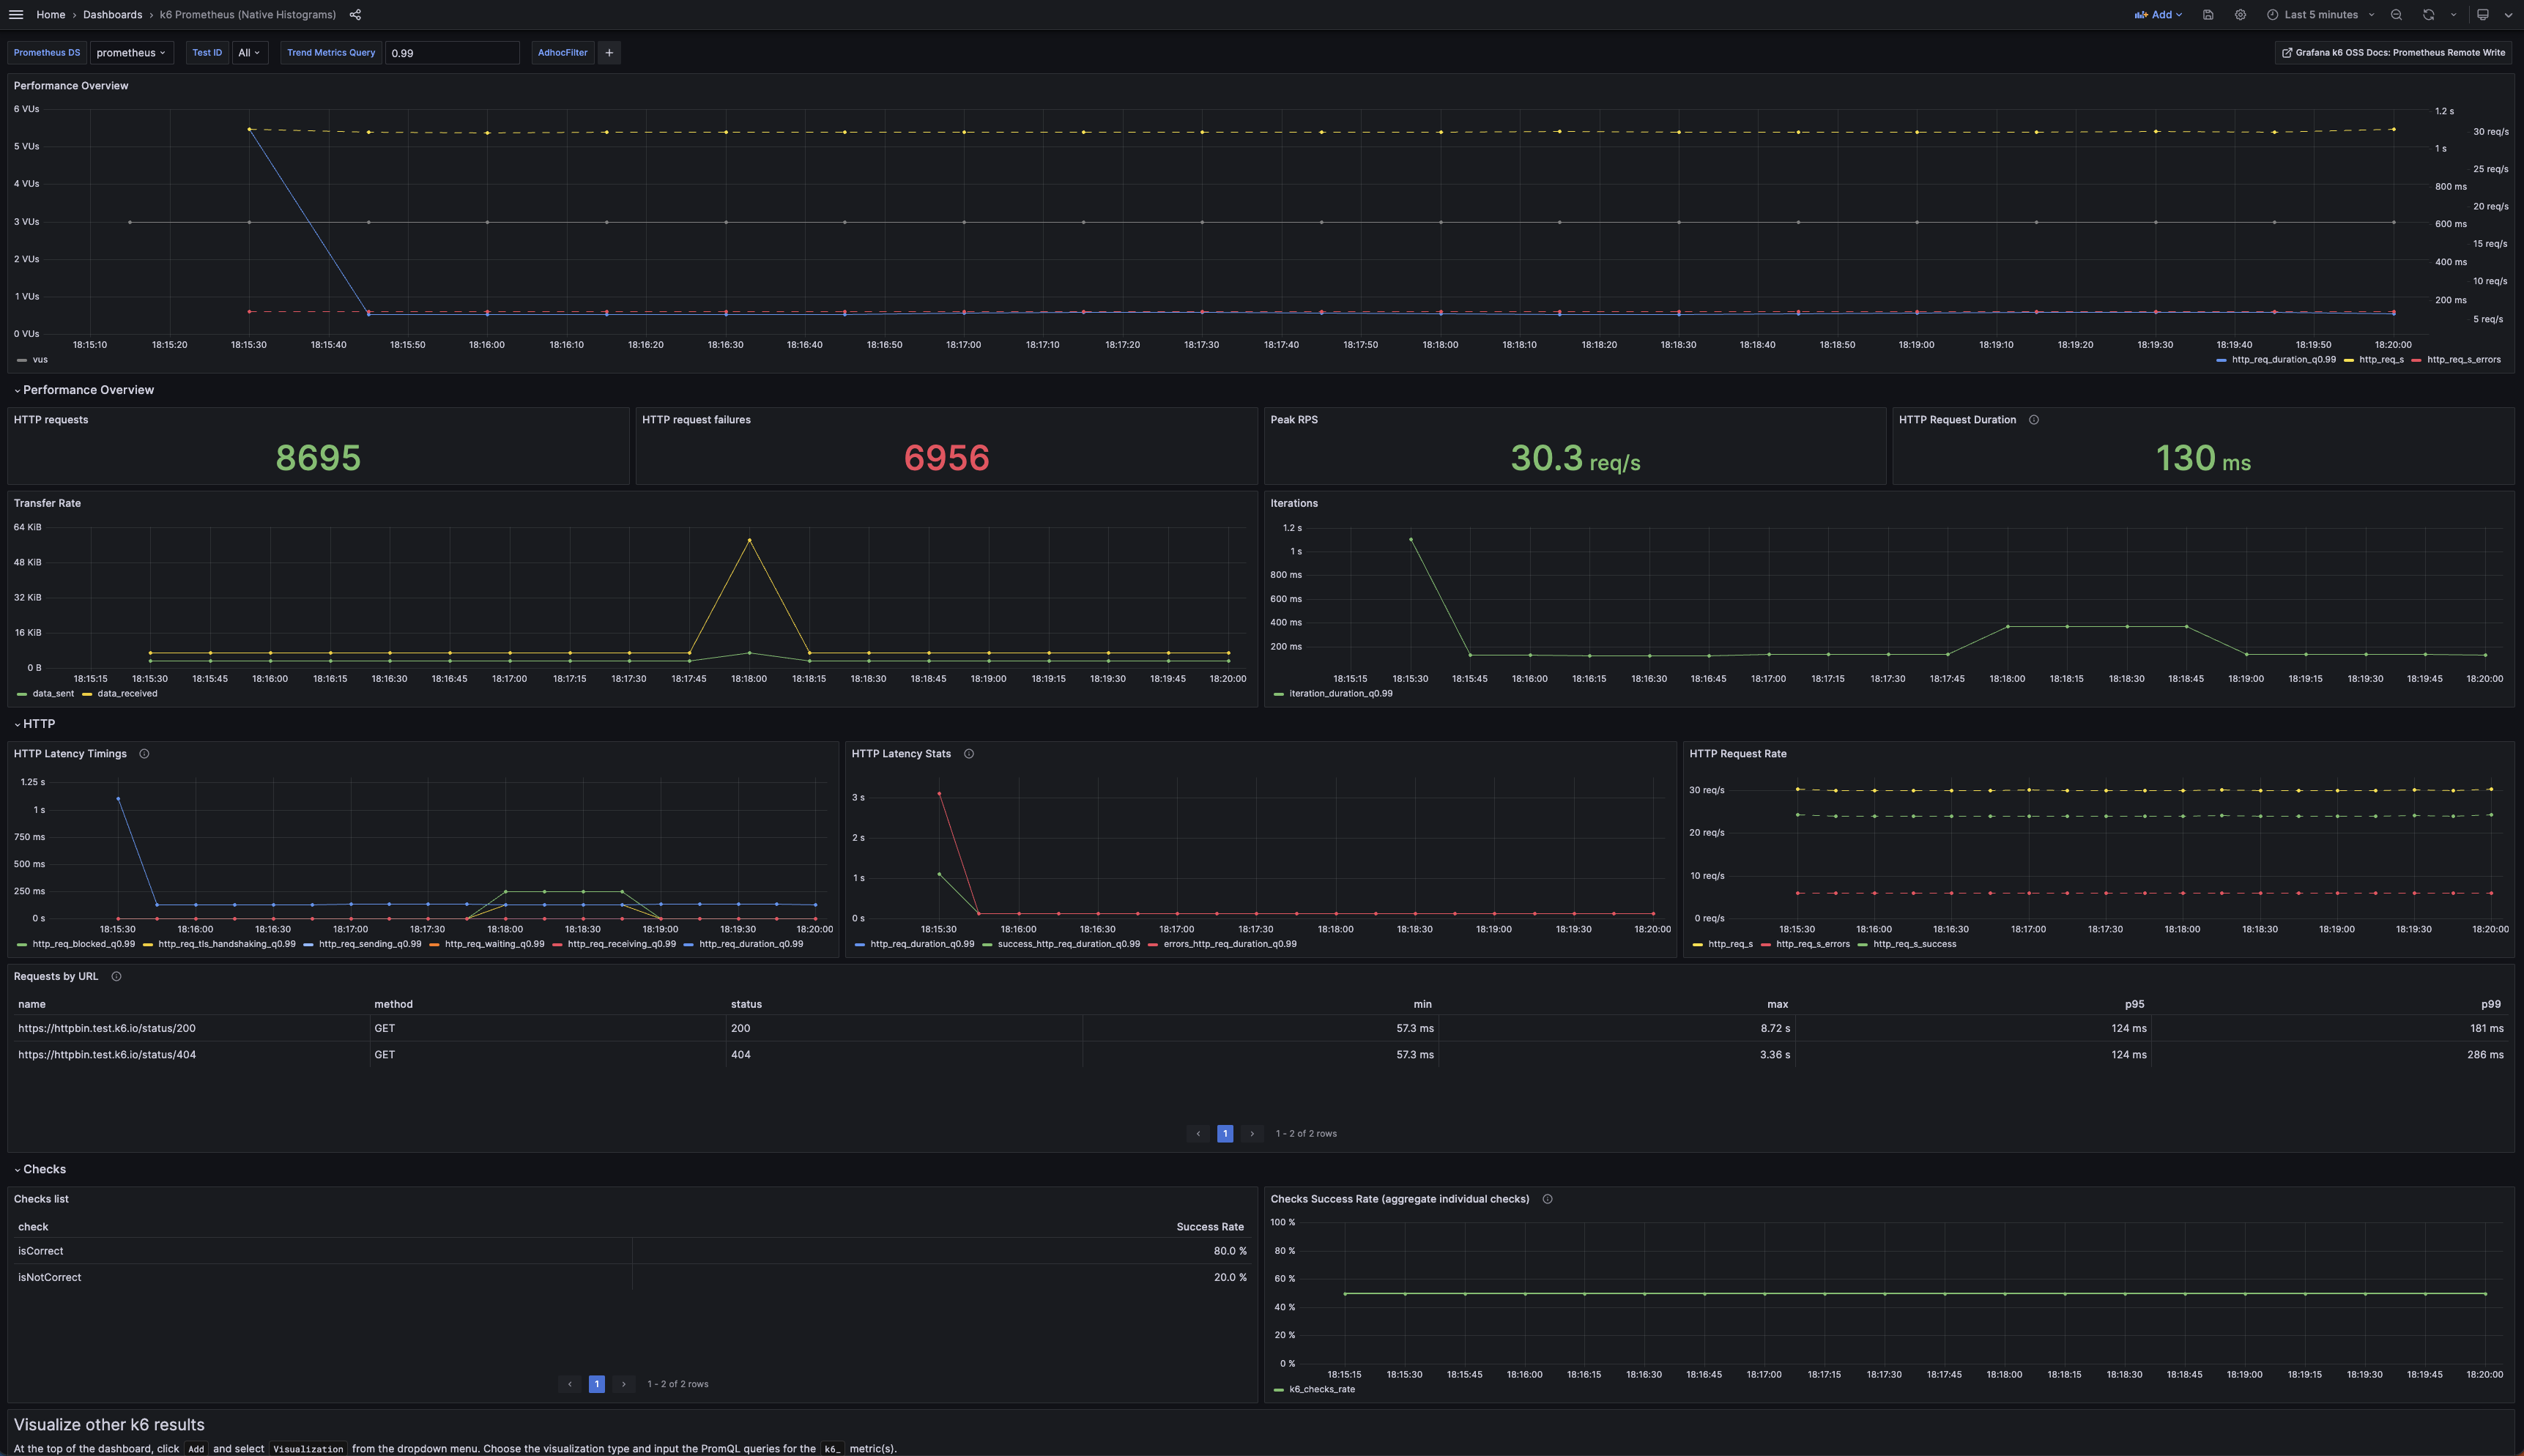
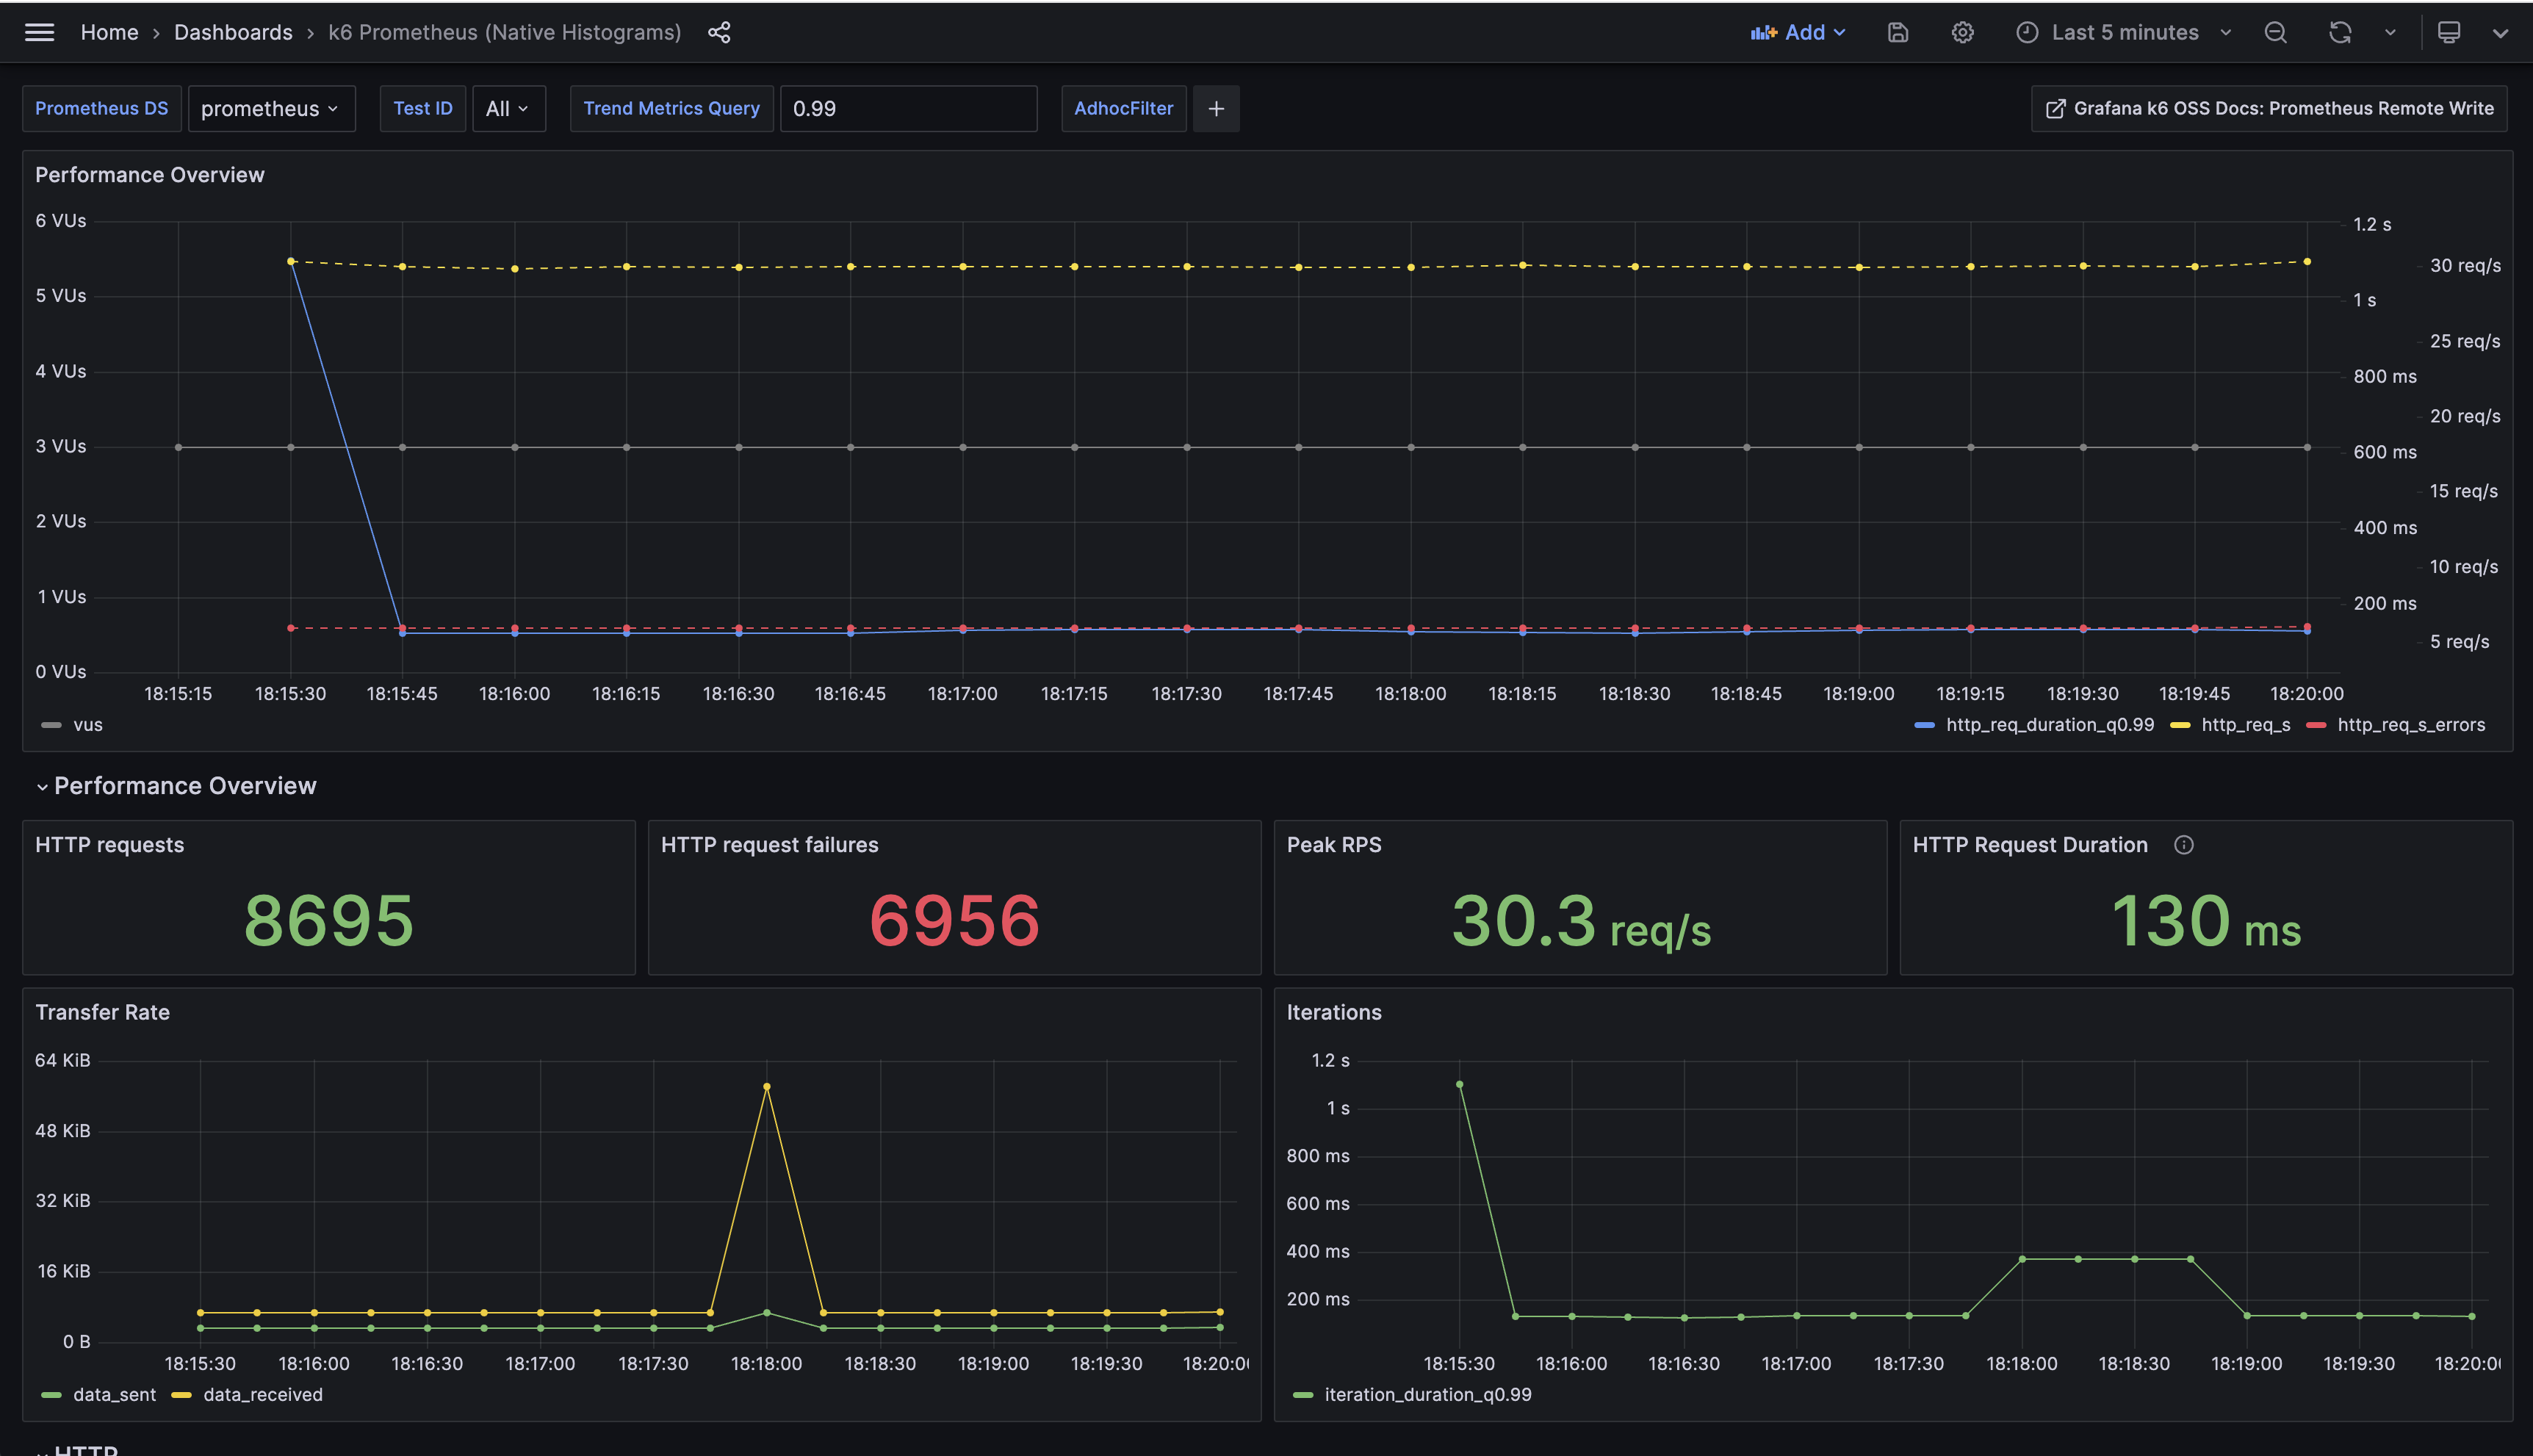
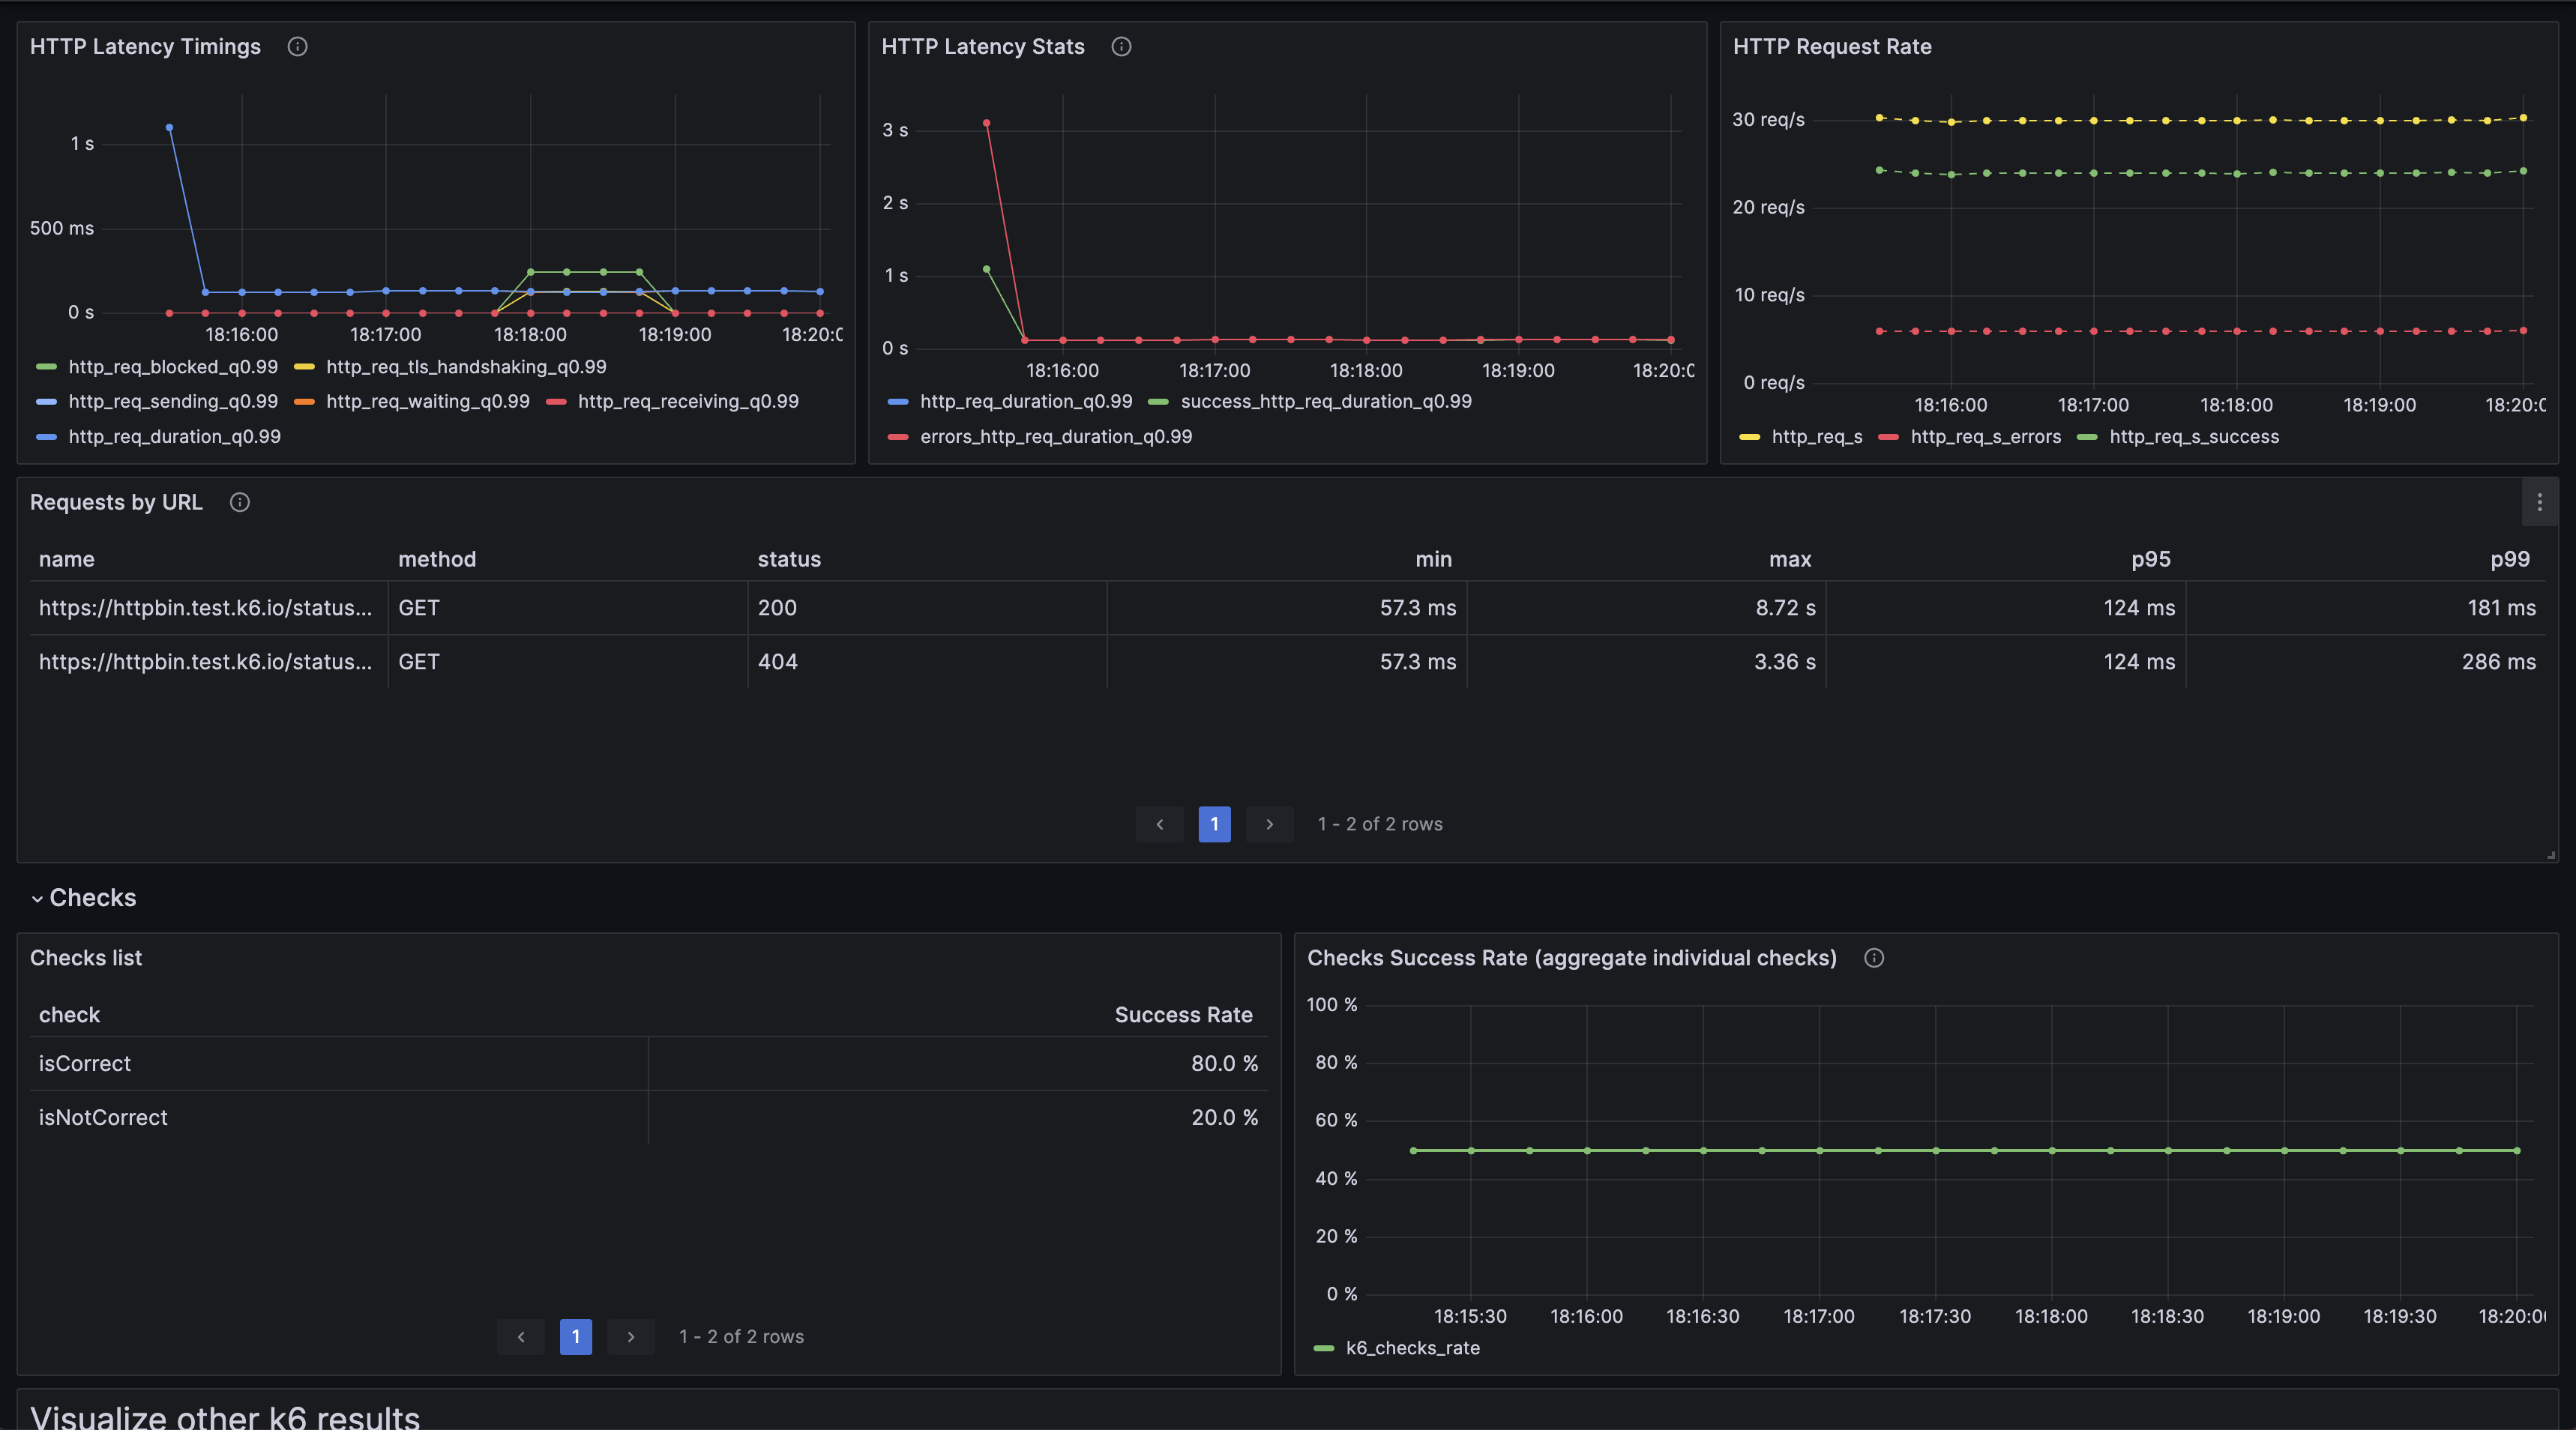
This is the "official" k6 Prometheus Dashboard using native histogram metrics provided by the Grafana k6 maintainers.
This dashboard queries k6 test result metrics stored in Prometheus with k6 trend metrics converting to native histogram metrics. Check out the k6 docs to enable native histogram on Prometheus and the k6 output option.
If you have not exported k6 metrics as native histograms, use the k6 Prometheus Dashboard.
Contributions welcome! Open a feature request, bug report, or PR in our Github repository. The source code of this dashboard is available here.
Data source config
Collector config:
Upload an updated version of an exported dashboard.json file from Grafana
| Revision | Description | Created | |
|---|---|---|---|
| Download |
Metrics Endpoint (Prometheus)
Easily monitor any Prometheus-compatible and publicly accessible metrics URL with Grafana Cloud's out-of-the-box monitoring solution.
Learn more