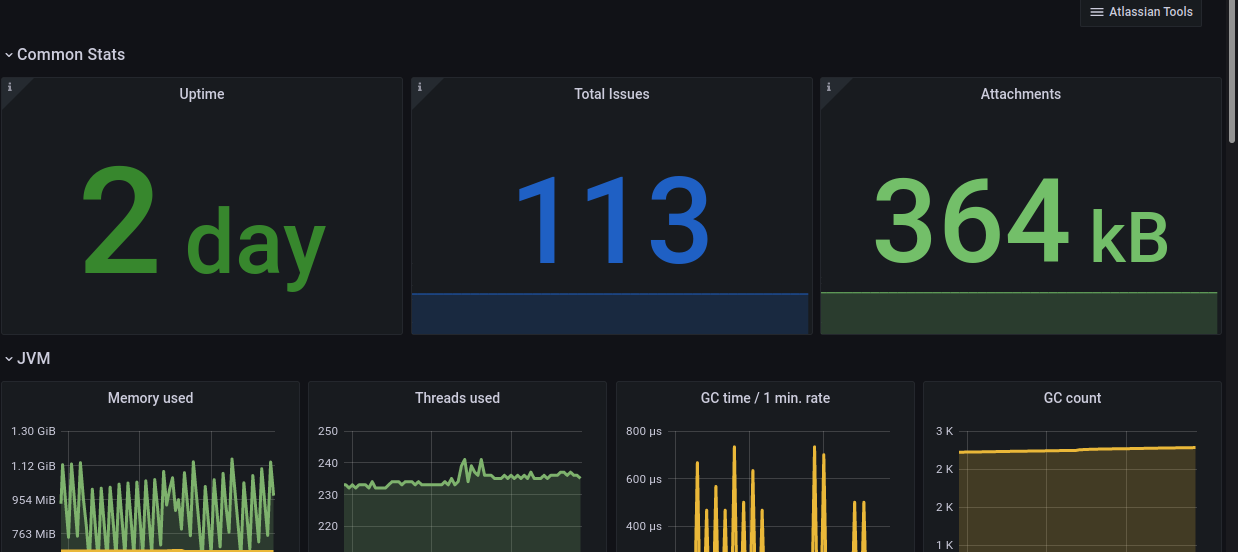
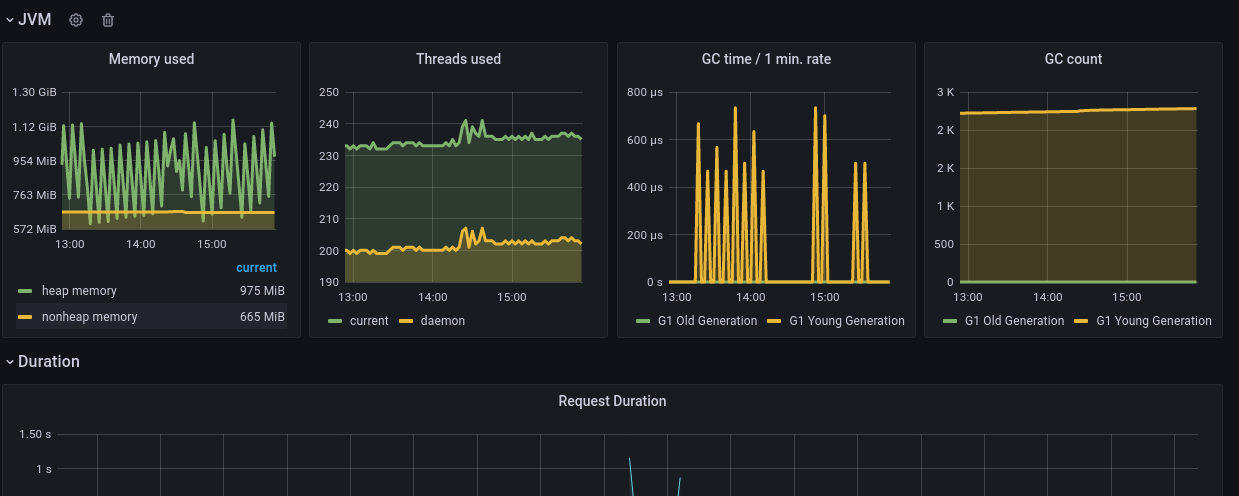
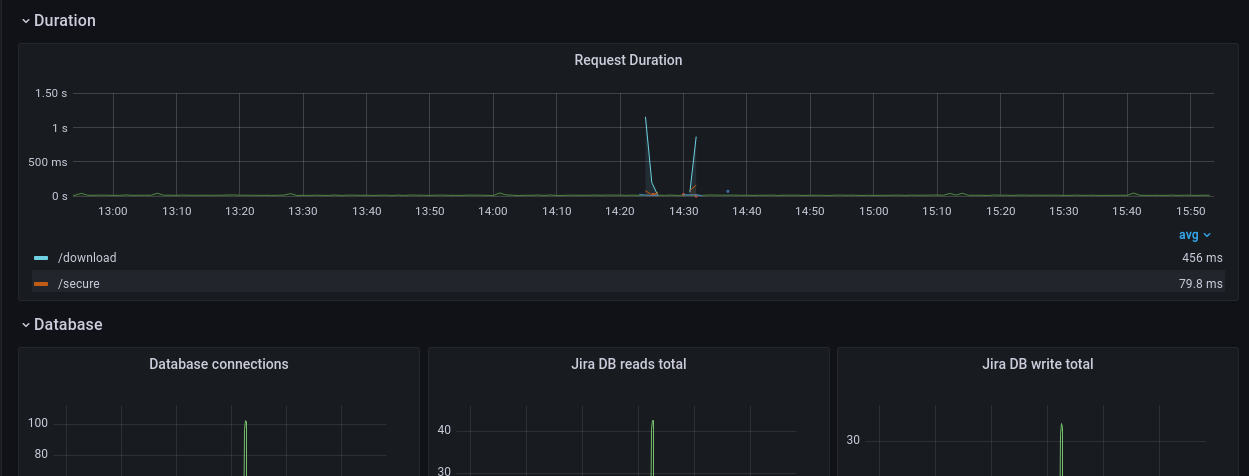
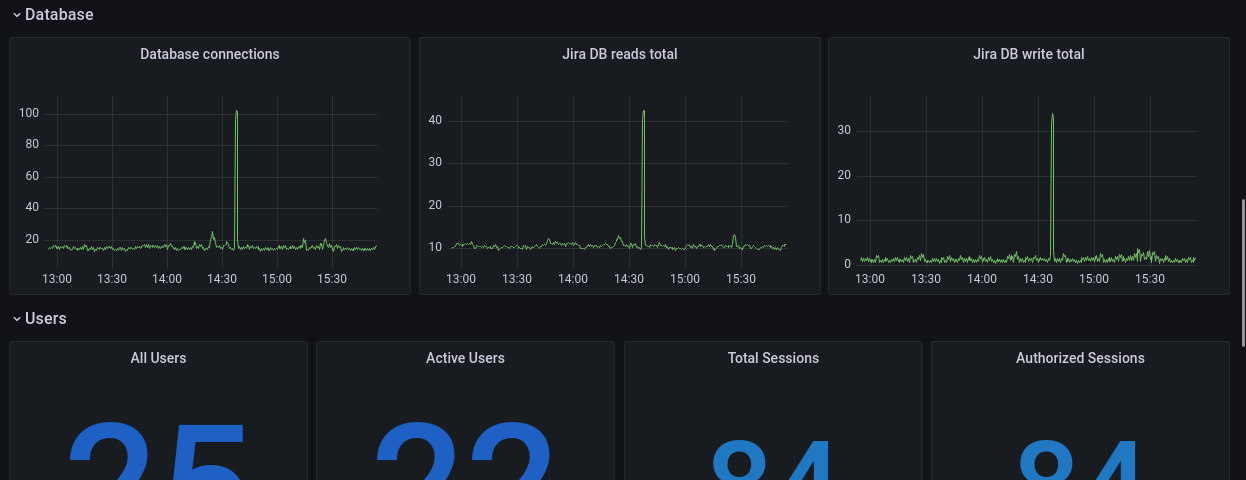
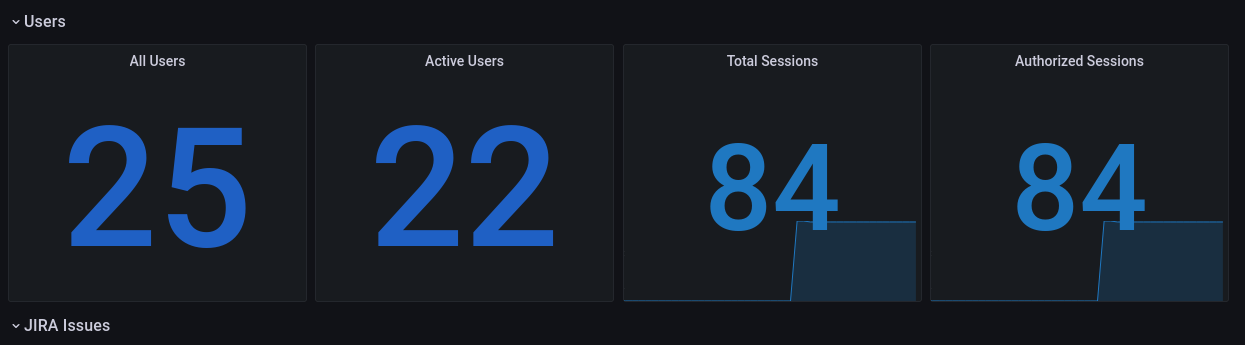
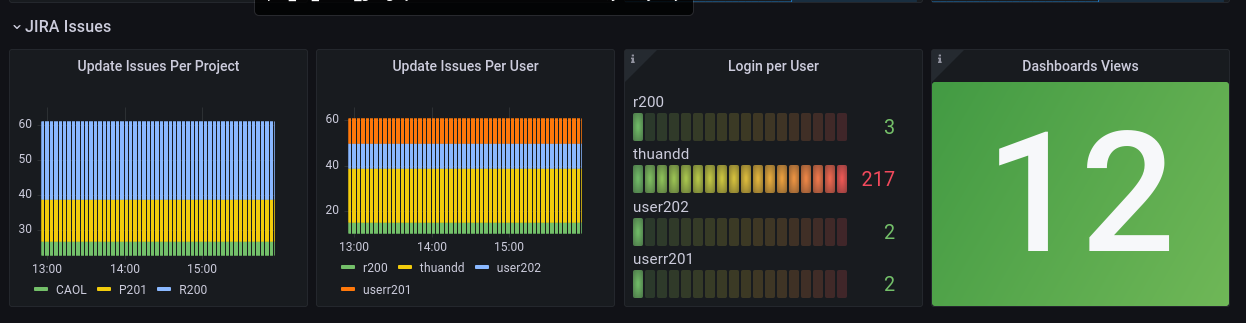
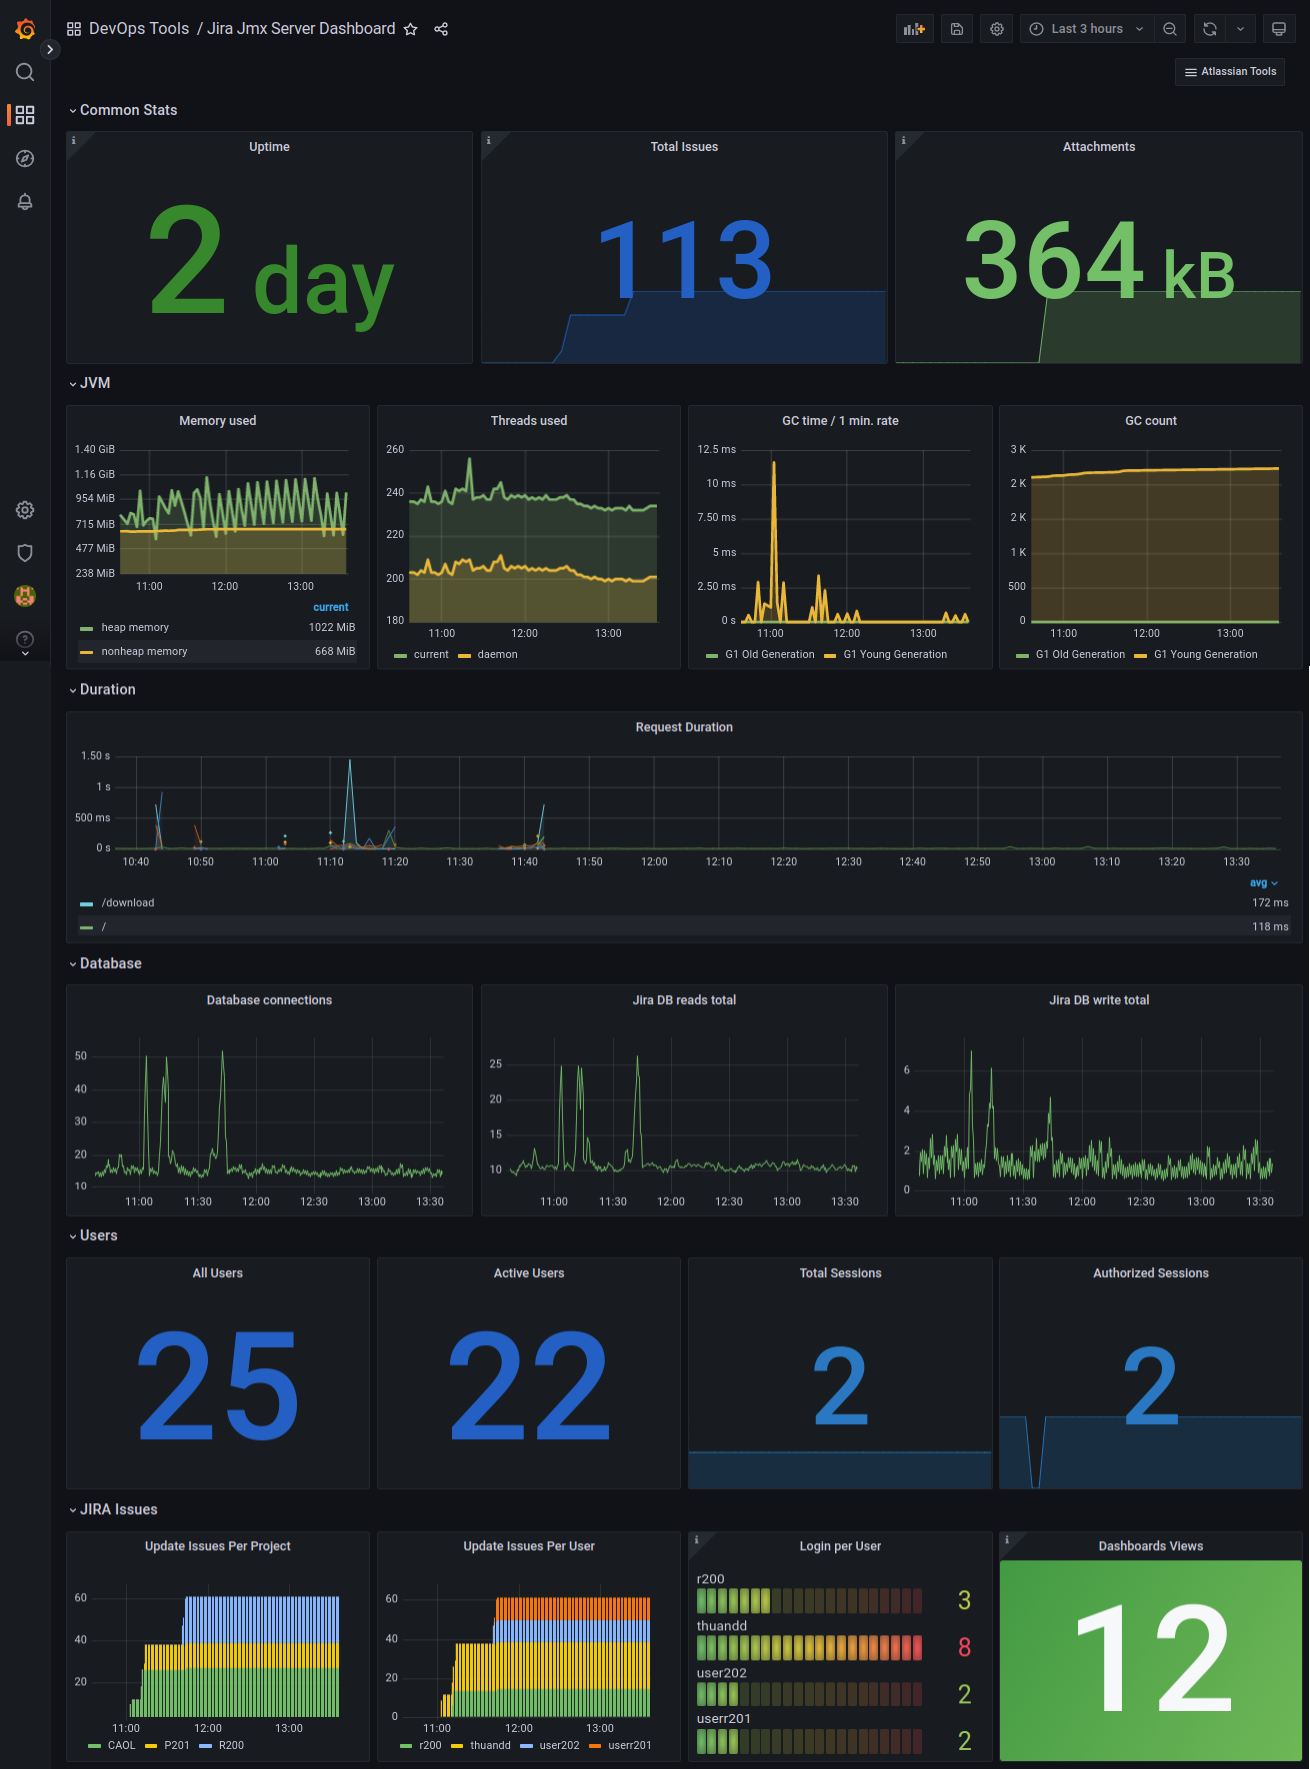
Jira Server Dashboard
Shows Jira JVM and usage metrics
- Go to Jira administration > Manage apps
- Search plugin
Prometheus Exporter For Jiraand install - After plug-in is successfully installed the following link can be used to expose metrics:
plugins/servlet/prometheus/metrics - The prometheus.yml settings
  - job_name: 'jira'
    scheme: http
    metrics_path: '/plugins/servlet/prometheus/metrics'
    params:
         token: ['OvFKyqNsqvKLNk0YVOQ7ER2e9u4hs92DbkI']
    static_configs:
      - targets: ['192.168.3.56:8089']
- Import Grafana Dashboard
Data source config
Collector type:
Collector plugins:
Collector config:
Revisions
Upload an updated version of an exported dashboard.json file from Grafana
| Revision | Description | Created | |
|---|---|---|---|
| Download |
Jira
Easily monitor Jira, a tool for planning, tracking, and releasing software, with Grafana Cloud's out-of-the-box monitoring solution.
Learn more