Firewall_Monitor
SNMP dashboard for InfluxDB and Telegraf Plugin
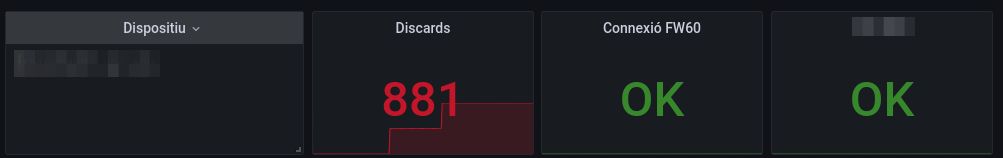
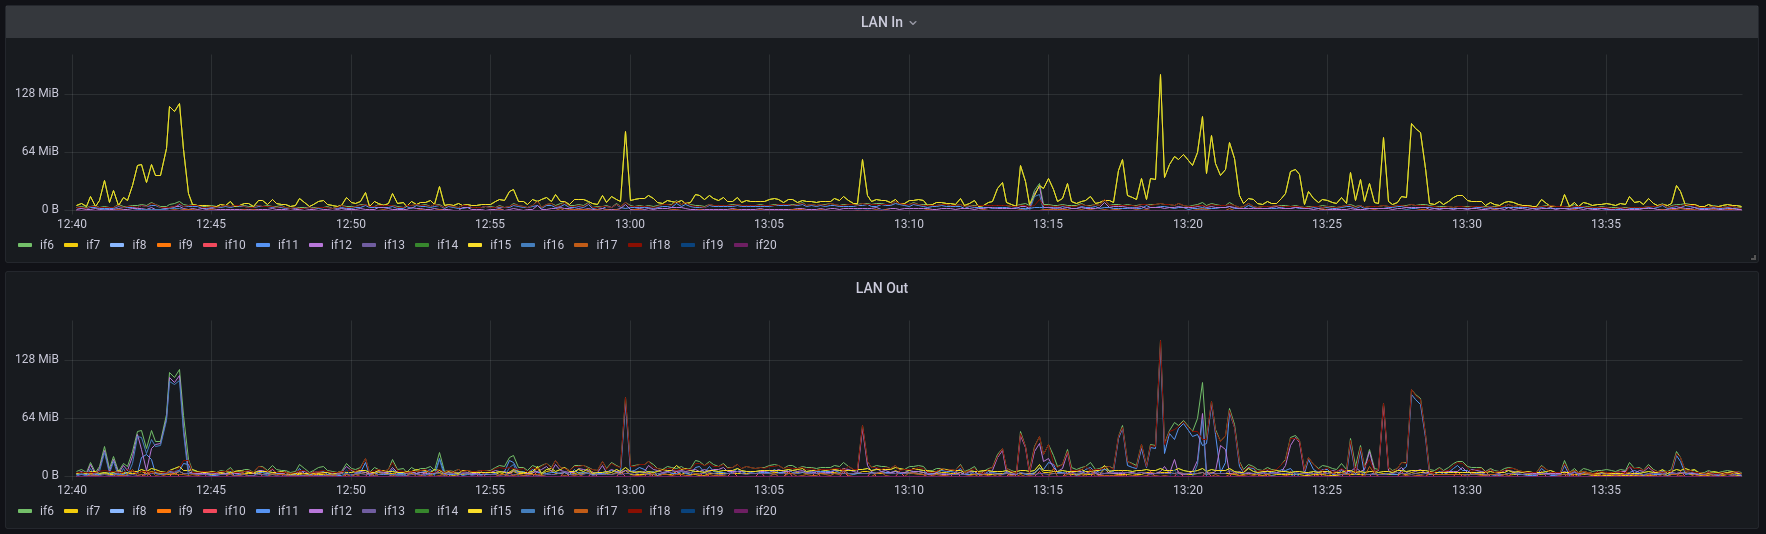
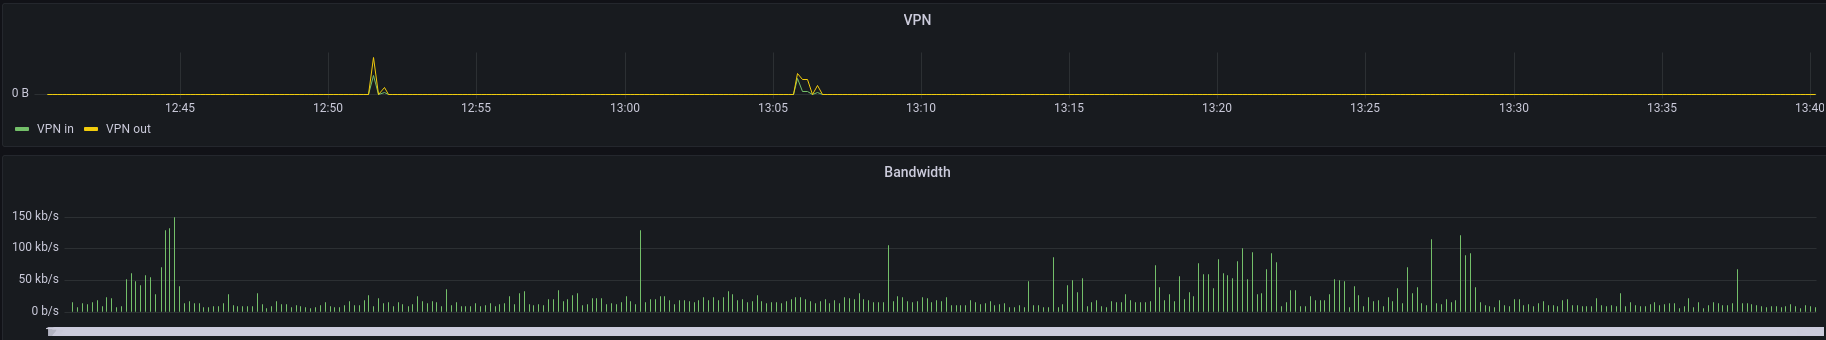
This dashboard is prepared to monitor an FW60 Fortigate Firewall: Amongst the items monitorized we can find the bit rate of every interface, ping status and overall bandwith of the device. Change the IP item inside the json for the IP address that suites to your systems. Change the hostname item inside the json for the hostname that suites to your systems.
Data source config
Collector type:
Collector plugins:
Collector config:
Revisions
Upload an updated version of an exported dashboard.json file from Grafana
| Revision | Description | Created | |
|---|---|---|---|
| Download |