Hosted Metrics Usage Summary
Key usage and performance statistics of a Grafana Cloud Hosted Metrics service.
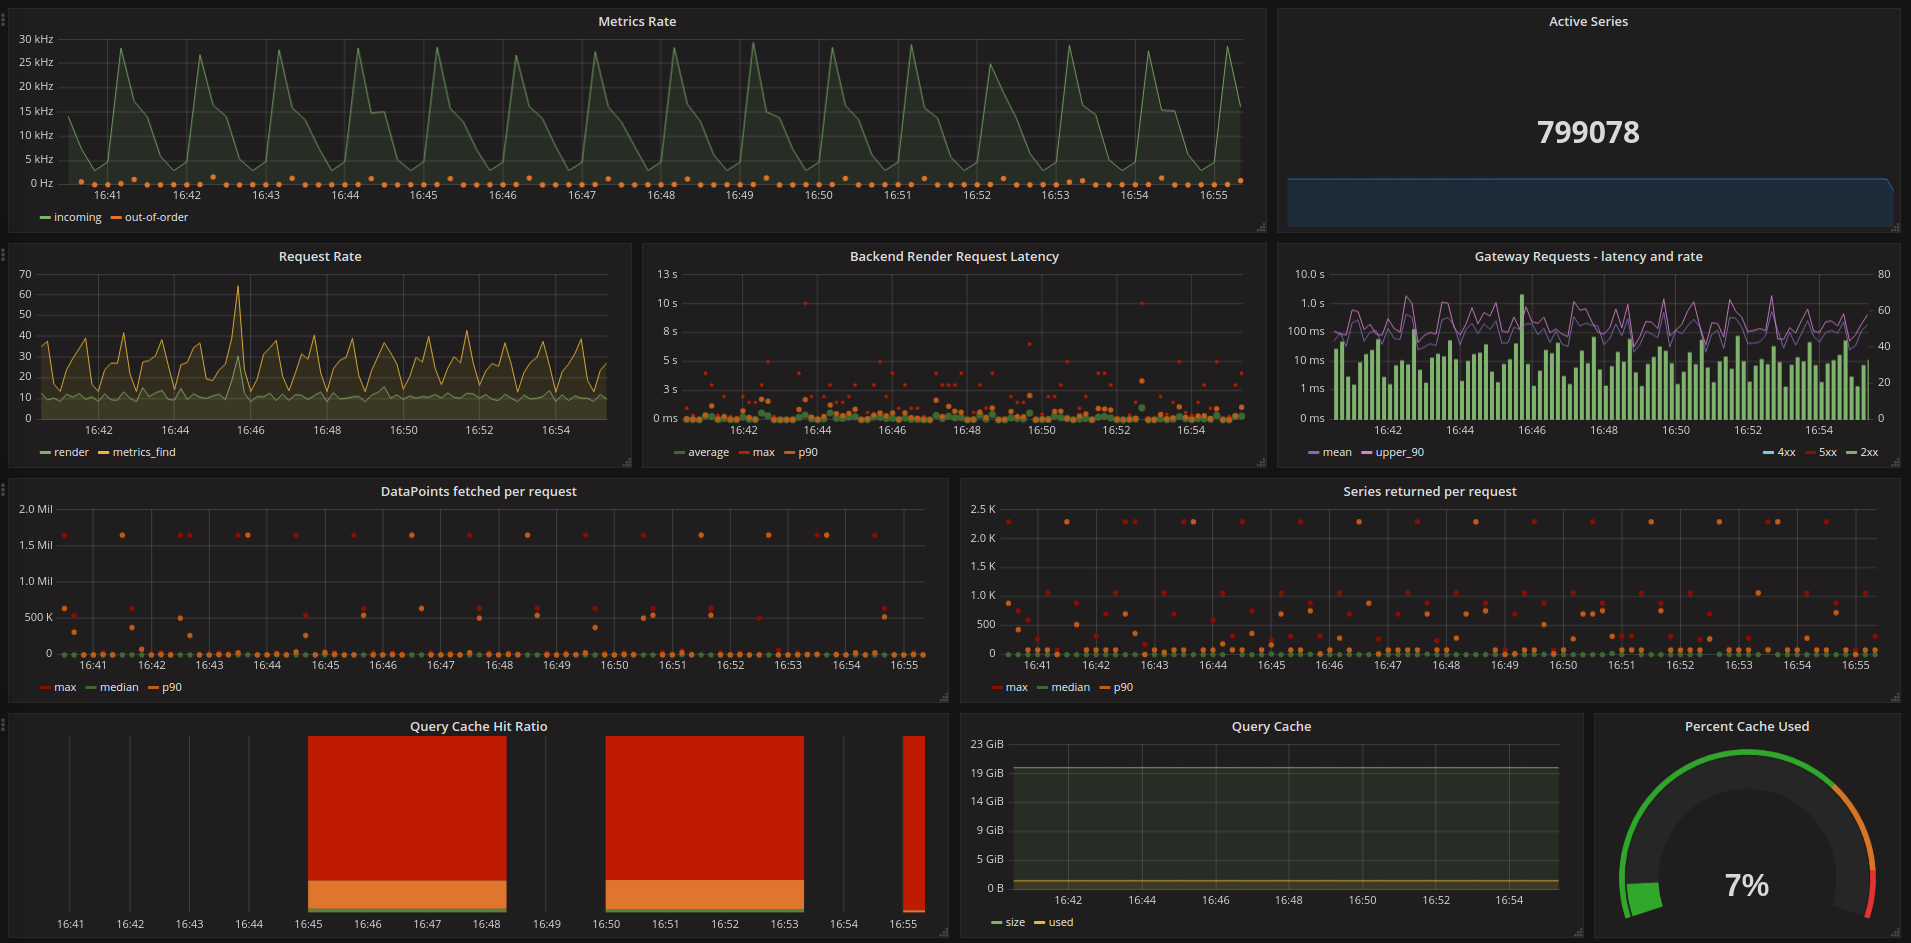
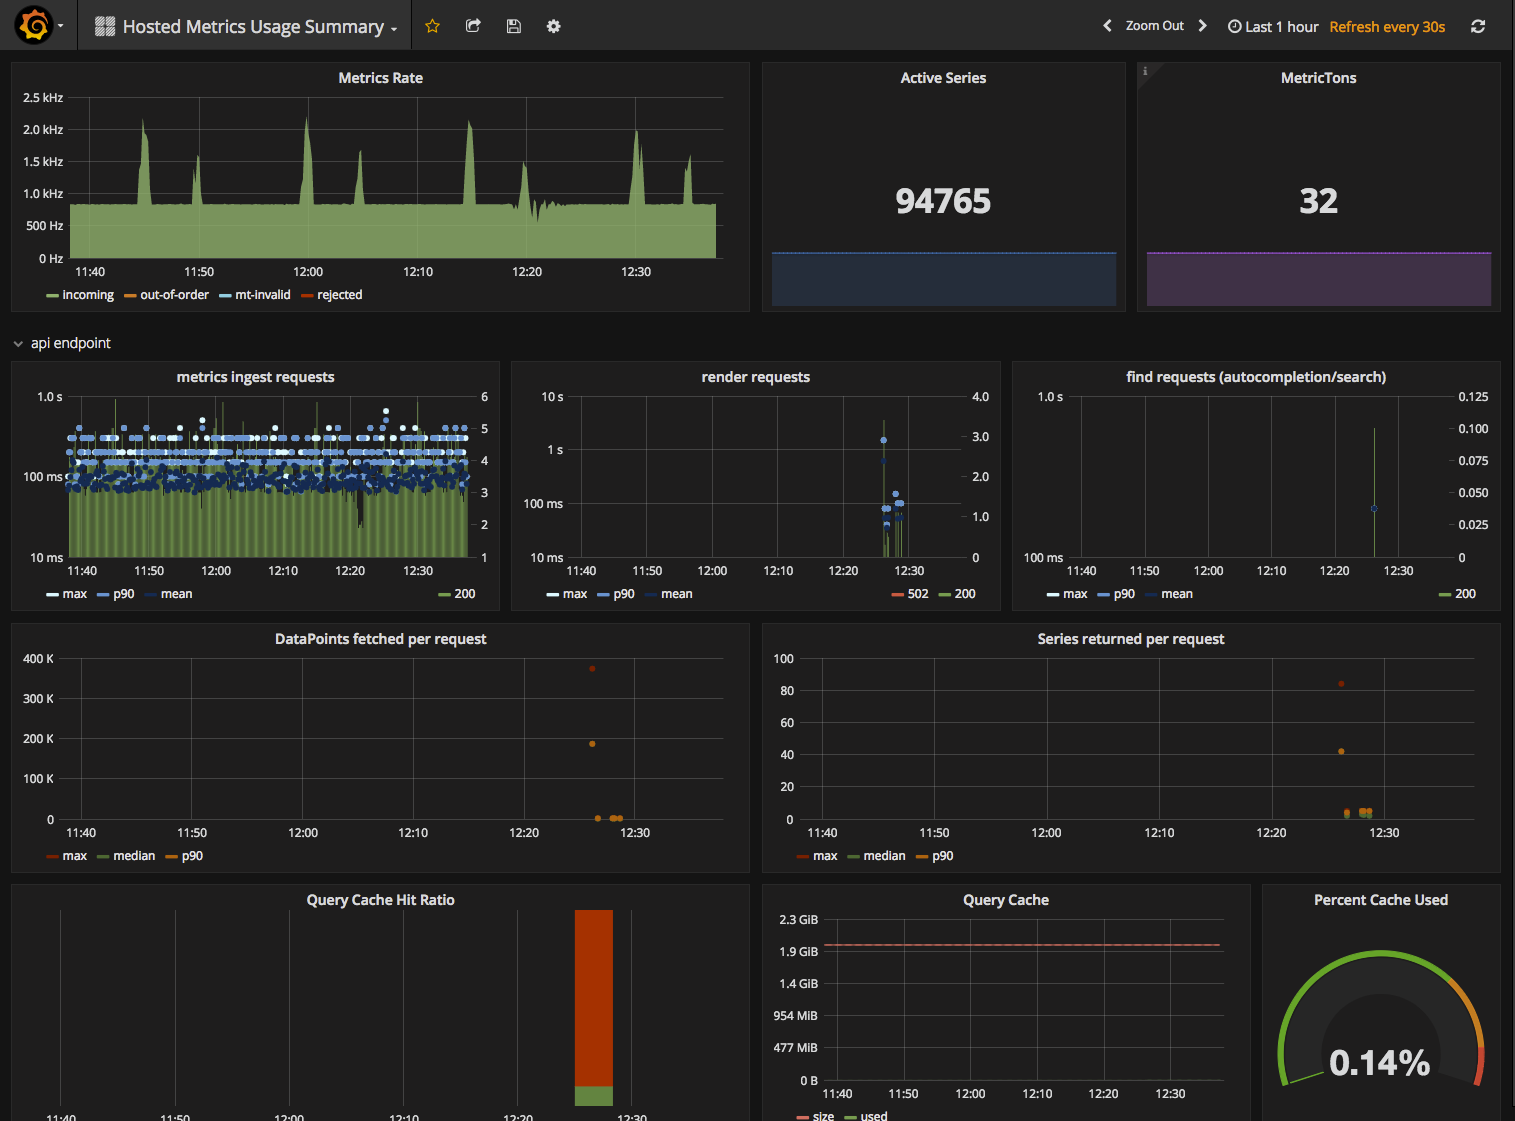
The hostedMetrics usage summary dashboard shows key internal metrics collected from a hostedMetrics service. These metrics are collected from and stored in the hostedMetrics time series database.
The primary purpose of this dashboard is to allow users to have insight into how their hostedMetrics services is performing and be able to manage their utilization of the service.
Data source config
Collector config:
Upload an updated version of an exported dashboard.json file from Grafana
| Revision | Description | Created | |
|---|---|---|---|
| Download |
Grafana Loki (self-hosted)
Easily monitor Grafana Loki (self-hosted), a horizontally scalable, highly available, multi-tenant log aggregation system inspired by Prometheus, with Grafana Cloud's out-of-the-box monitoring solution.
Learn more