JMX Overview (OpenTelemetry)
Dashboard for JVM metrics with Prometheus / OpenTelemetry instrumentation

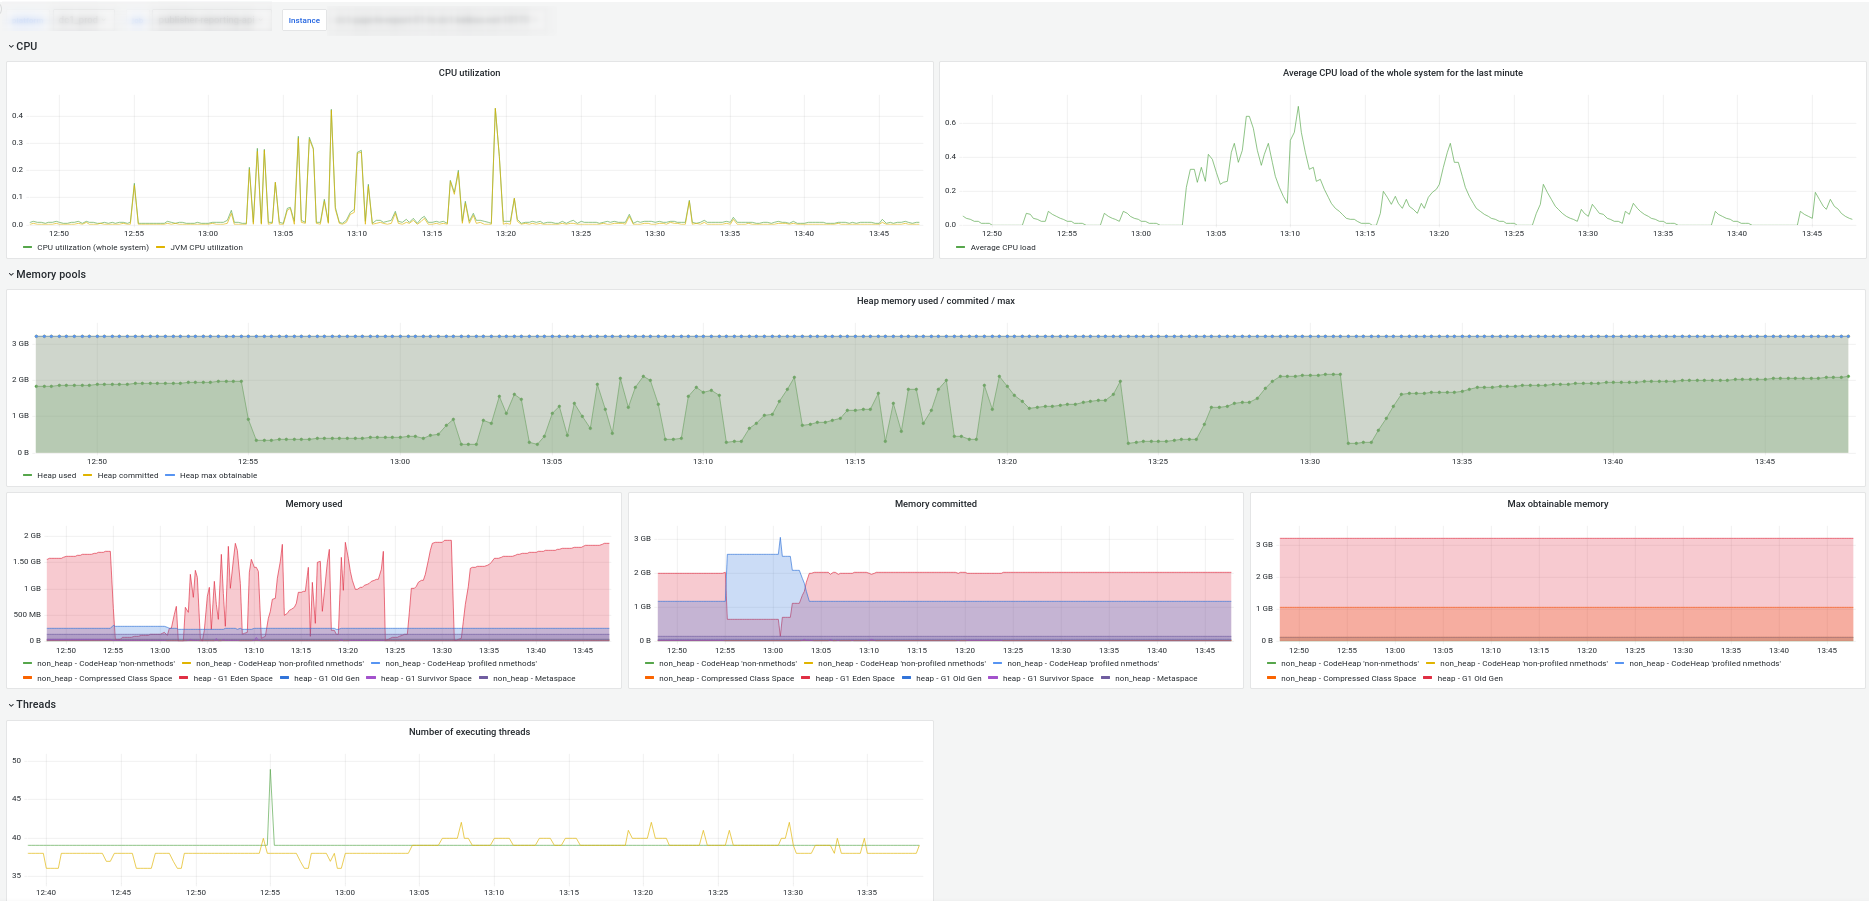
Dashboard for JVM metrics exposed by OpenTelemetry: CPU, memory, threads, garbage collector, classes.
2024-02 update: compatible with OTEL Instrumentation 2.x + add Kubernetes pod context
Data source config
Collector type:
Collector plugins:
Collector config:
Revisions
Upload an updated version of an exported dashboard.json file from Grafana
| Revision | Description | Created | |
|---|---|---|---|
| Download |