Apache Jmeter with influxDB Dashboard
Cloned Dashboard from official influxDB and noted the query type is flux, not fluxQl.
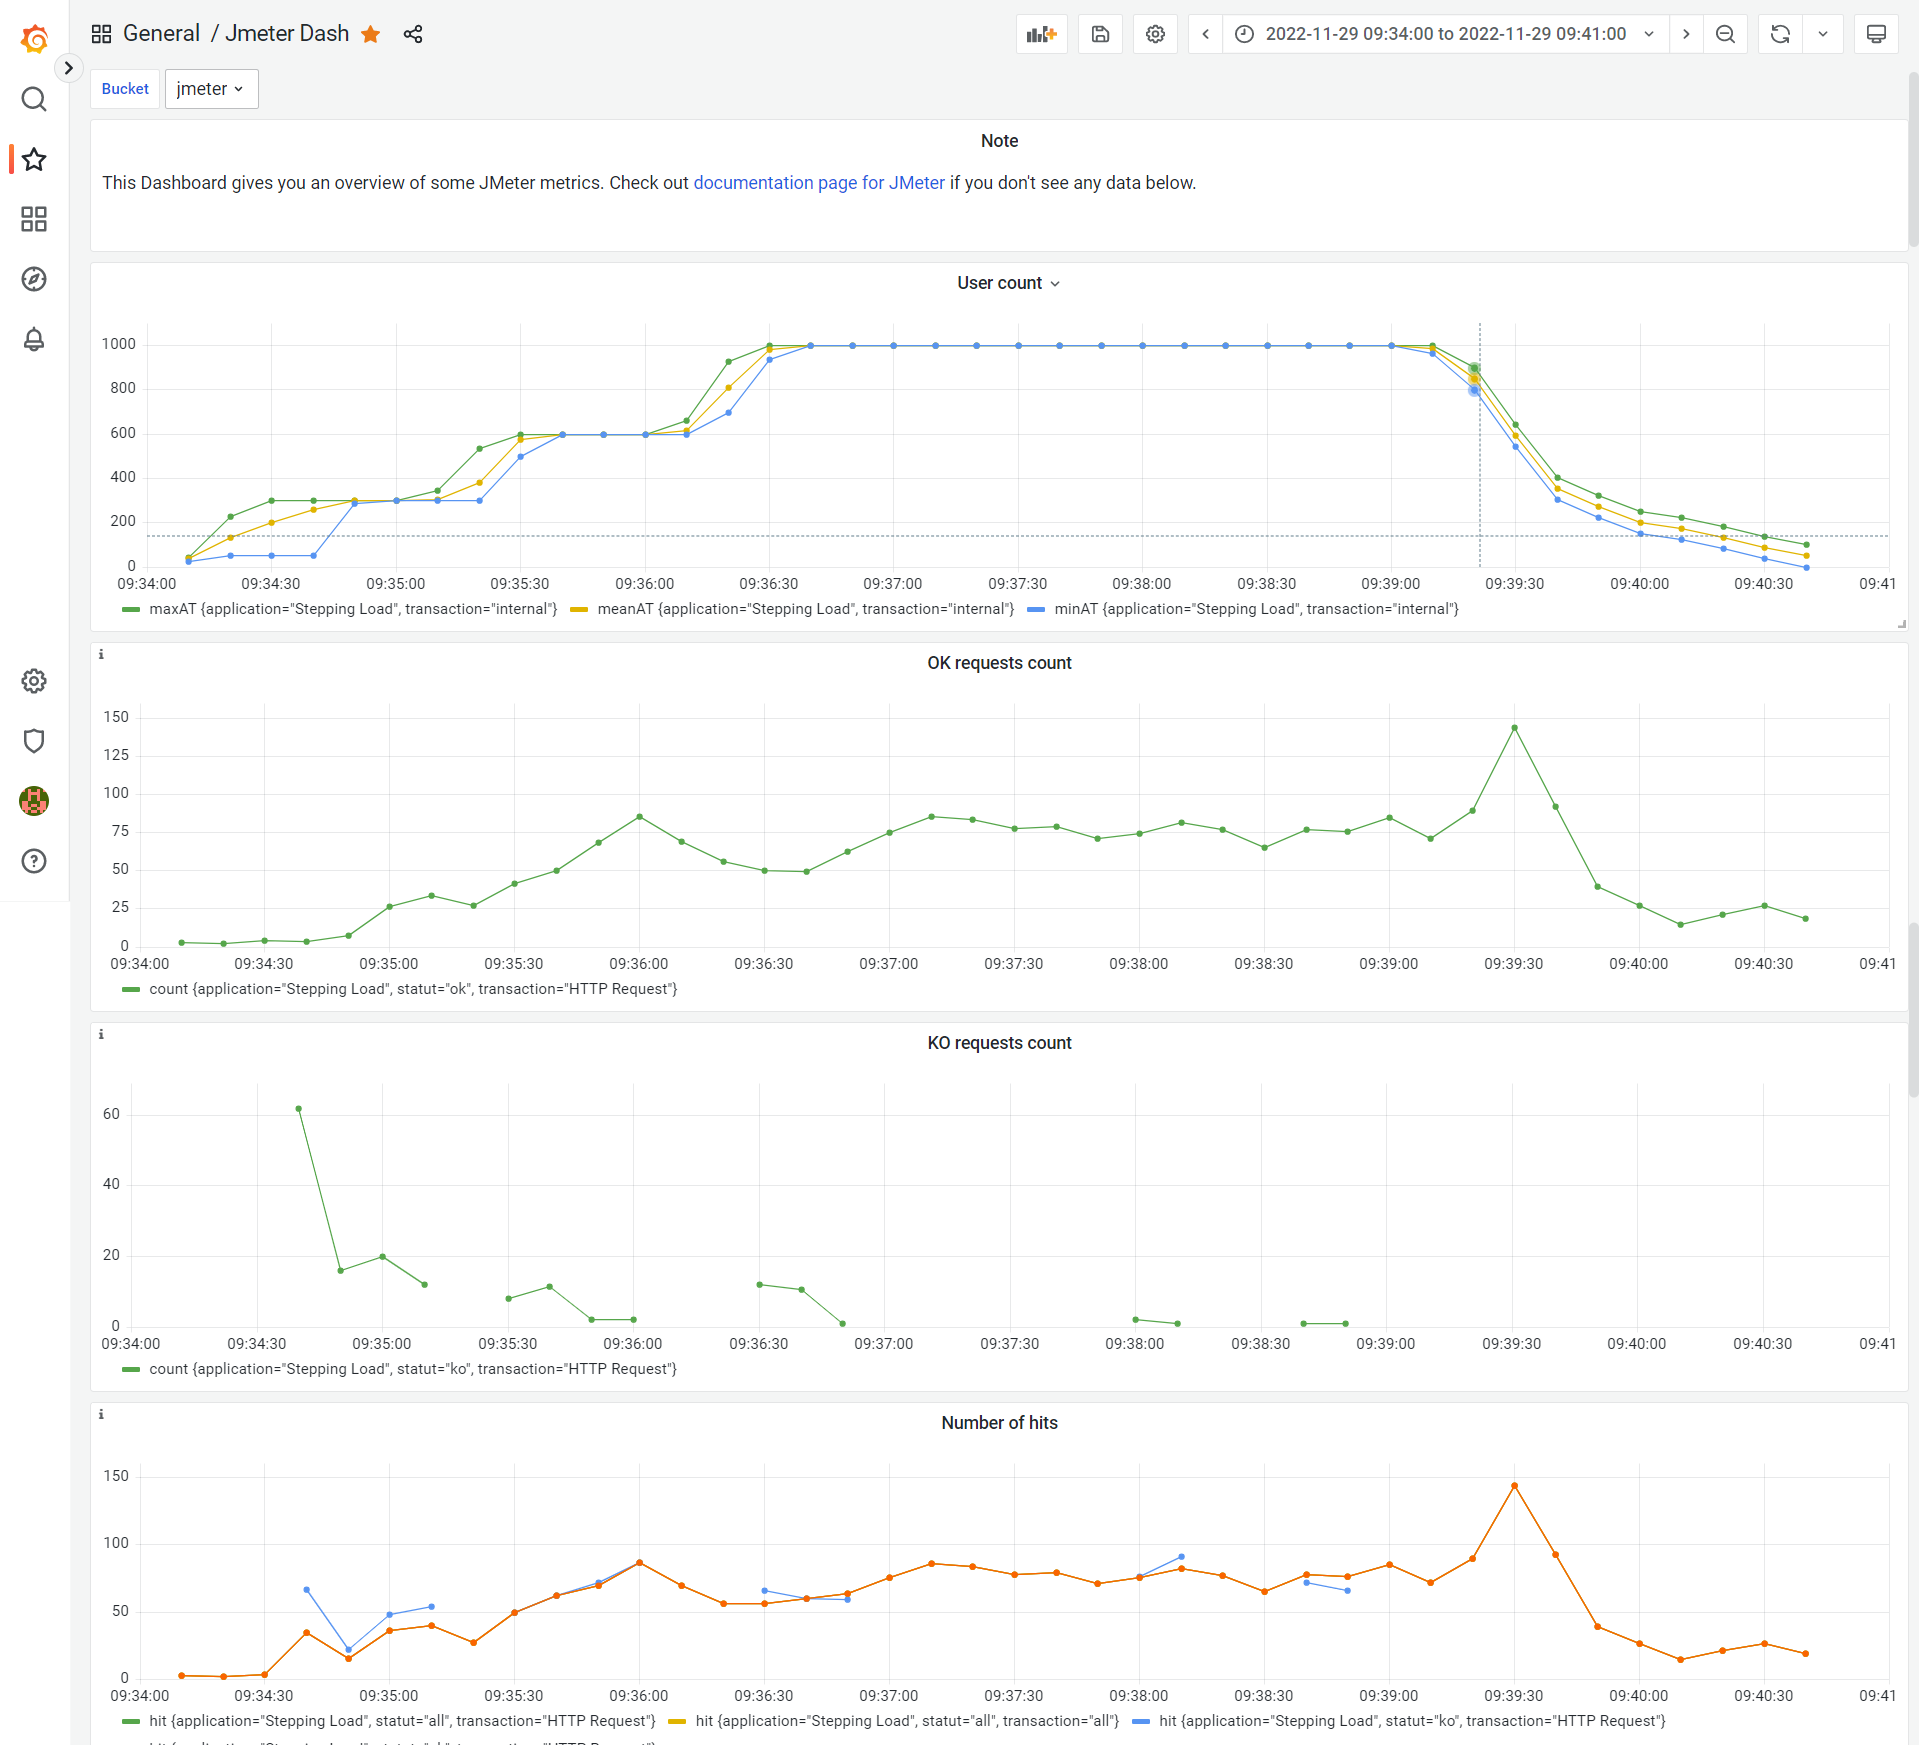
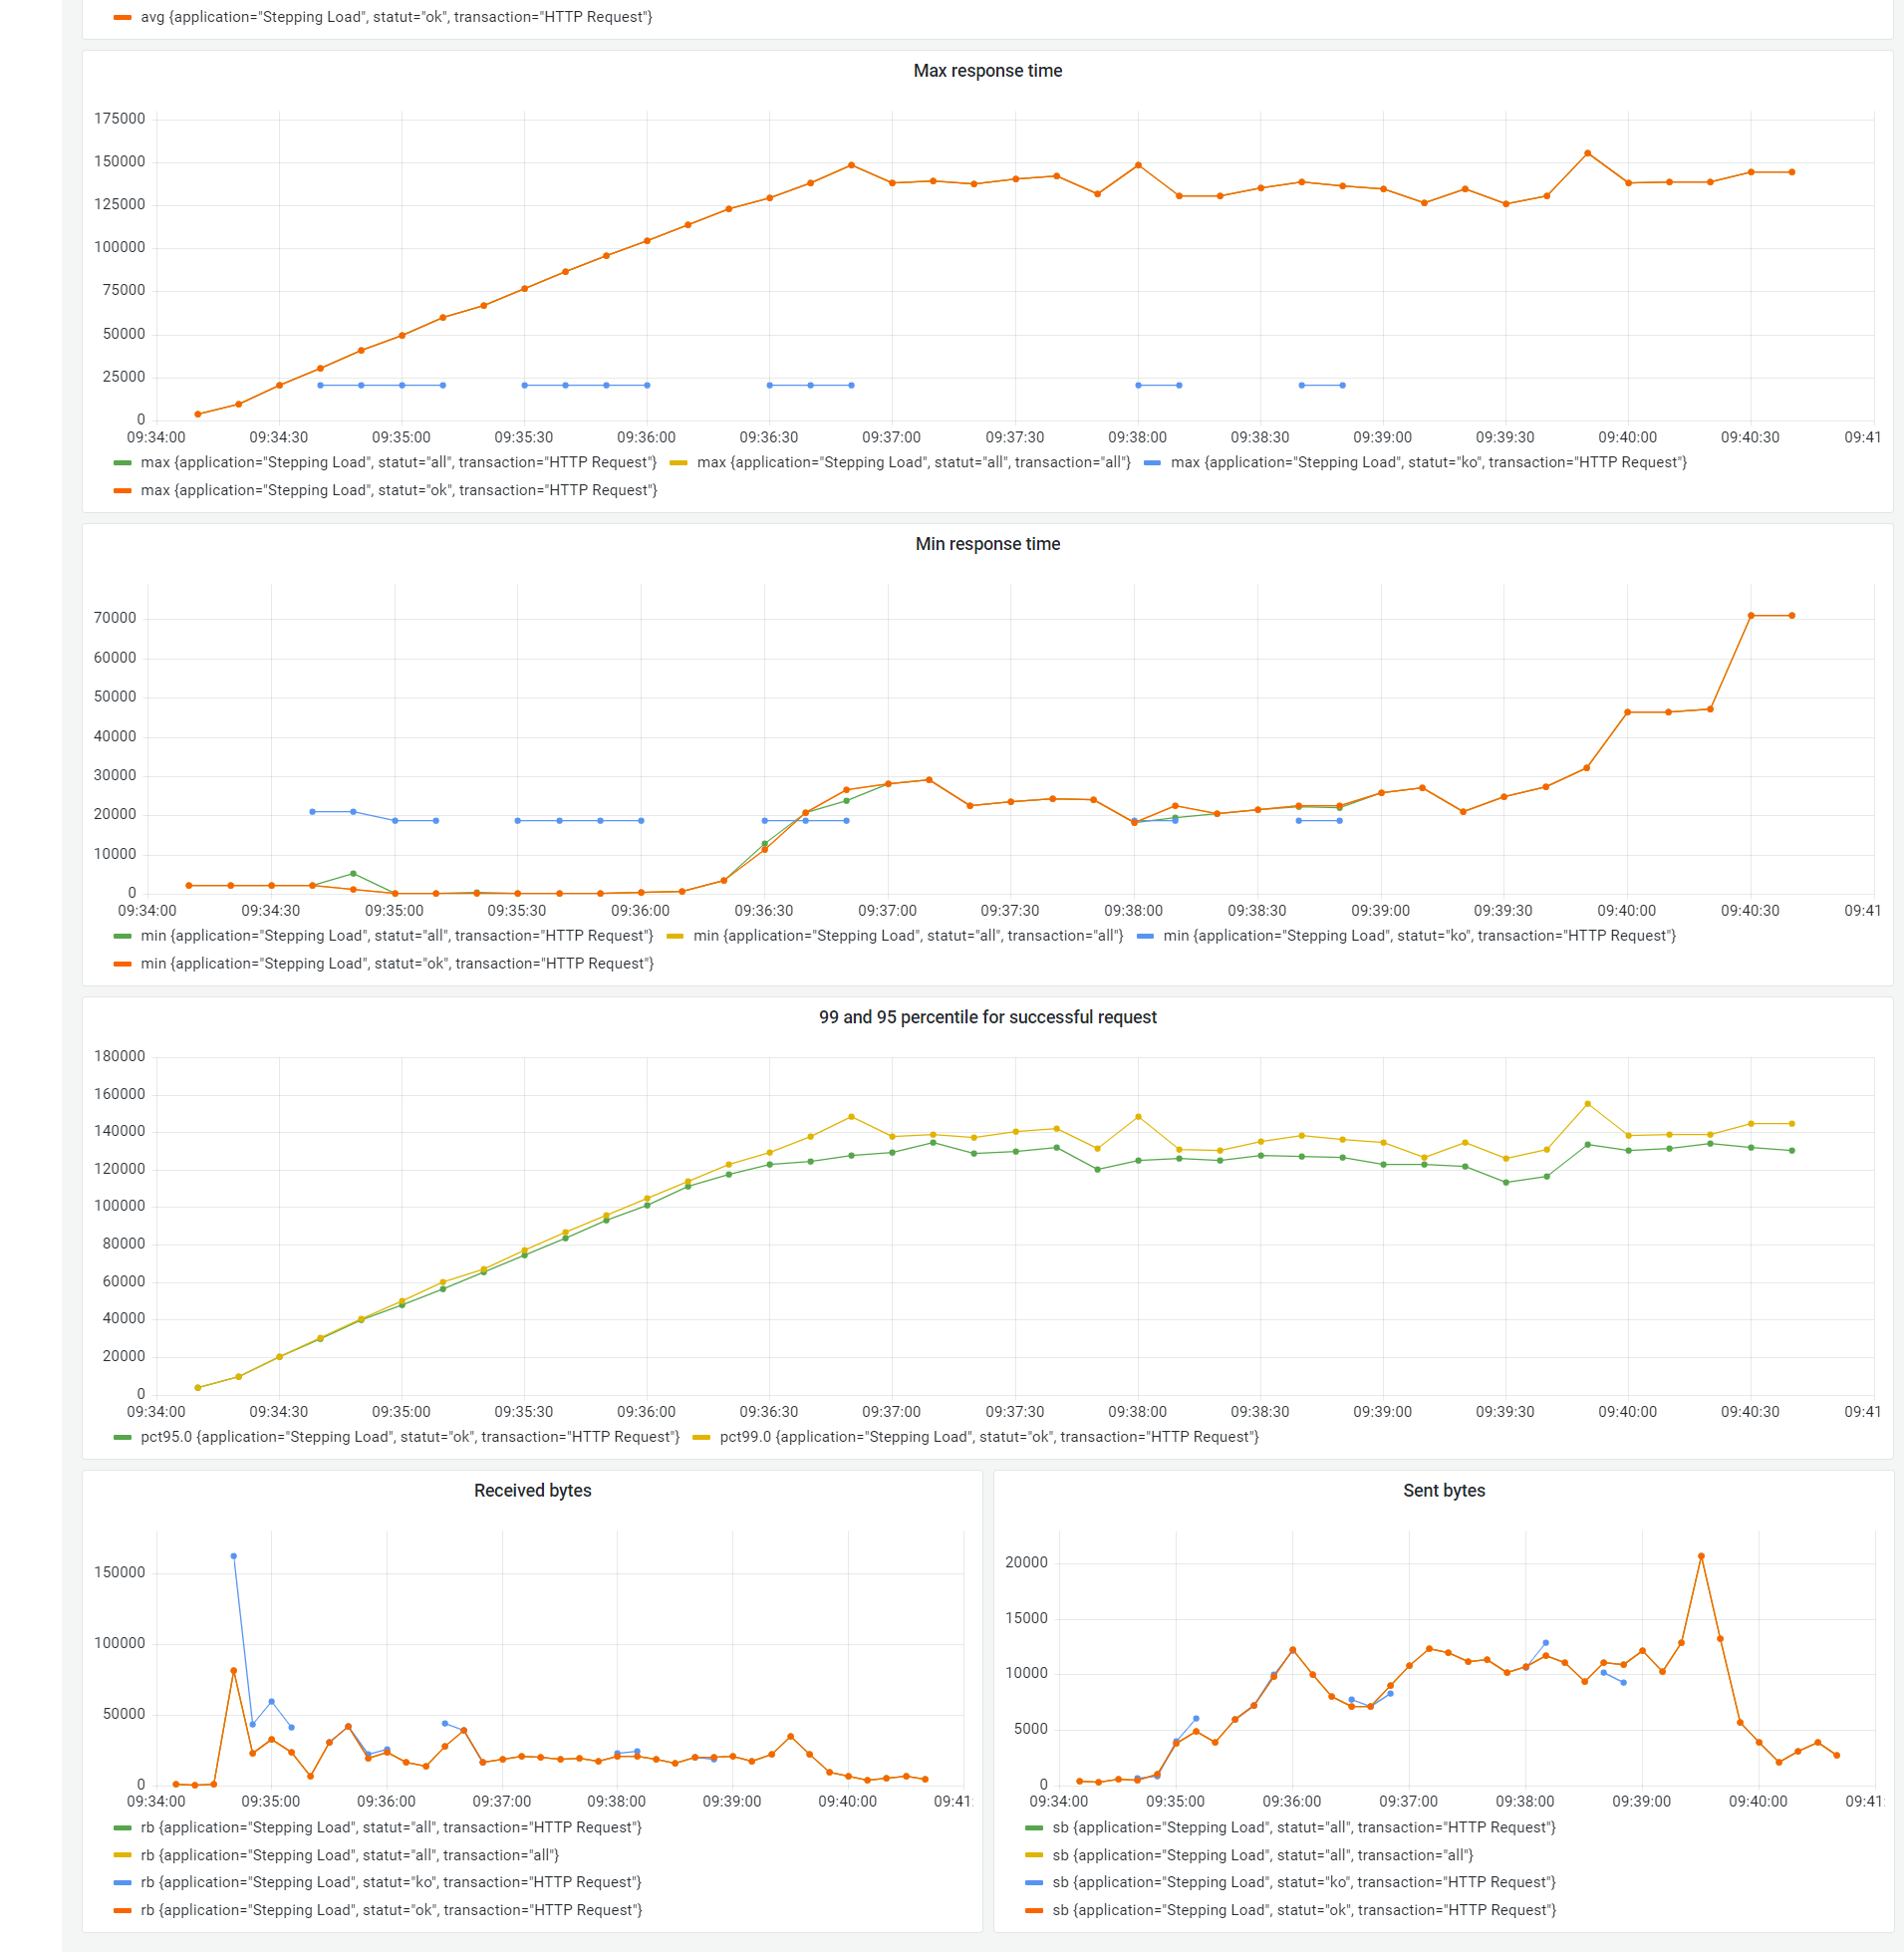
The Dashboard provides metrics about (User count, OK request count, KO request count, Number of hits, Avg response time, Max response time, Min response time, 99 and 95 percentile for successful request, Recived Bytes, Sent Bytes) its cloned from official influxDB to monitor Apache Jmeter metrics.
Data source config
Collector type:
Collector plugins:
Collector config:
Revisions
Upload an updated version of an exported dashboard.json file from Grafana
| Revision | Description | Created | |
|---|---|---|---|
| Download |
InfluxDB
Easily monitor InfluxDB, an open source time series database, with Grafana Cloud's out-of-the-box monitoring solution.
Learn more