JMeter Performance Testing Dashboard
JMeter performance testing live results dashboard, utilizing Flux queries (Influxdb 2.x)


https://github.com/fgeorge/jmeter-grafana-influxdb-dashboard
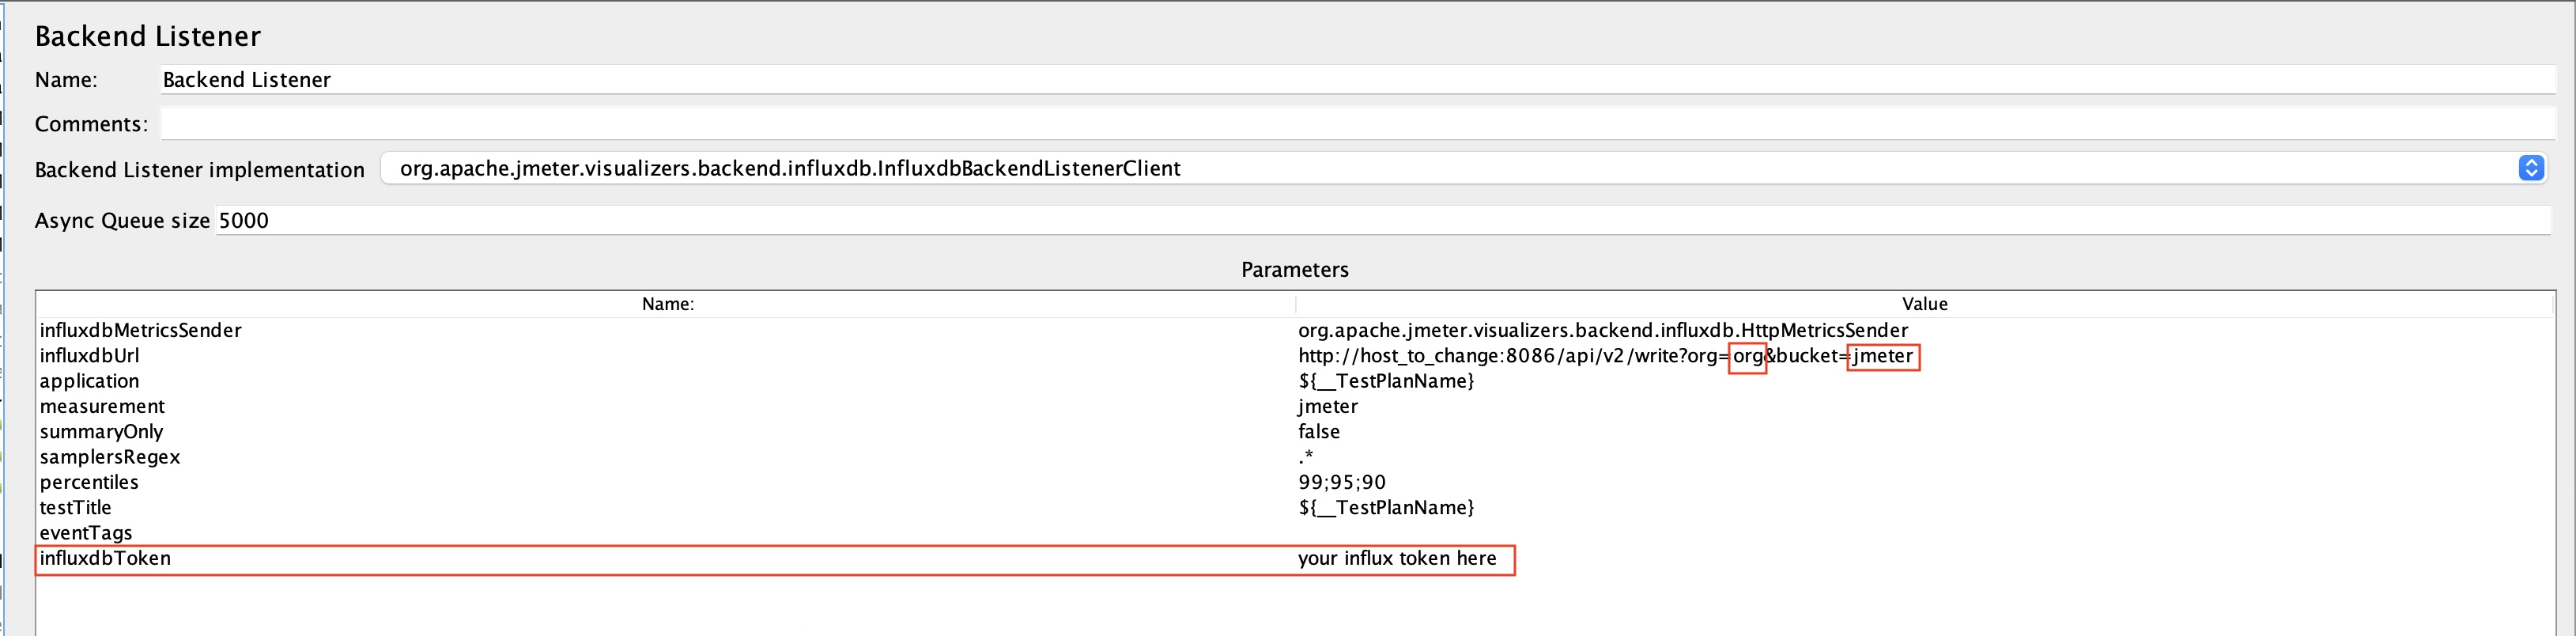
When running performance tests using Apache JMeter, to view the realtime test results and metrics we need to set up a backend listener that reports data to a timeseries db such as InfluxDB and then build a dashboard in Grafana/Influx etc. based on that data. There are lot of dashboards available in Grafana community. But with the newer versions of InfluxDB, Flux is us used as an alternative to InfluxQL language for querying and analyzing data. Unfortunately, most of the community provided dashboards are still using InfluxQL and there is no easy migration of the queries to the new Flux syntax. So, this is an attempt to build a Grafana dashboard using Flux as the query language for InfluxDB.
The Grafana dashboard will have the following metrics displayed.
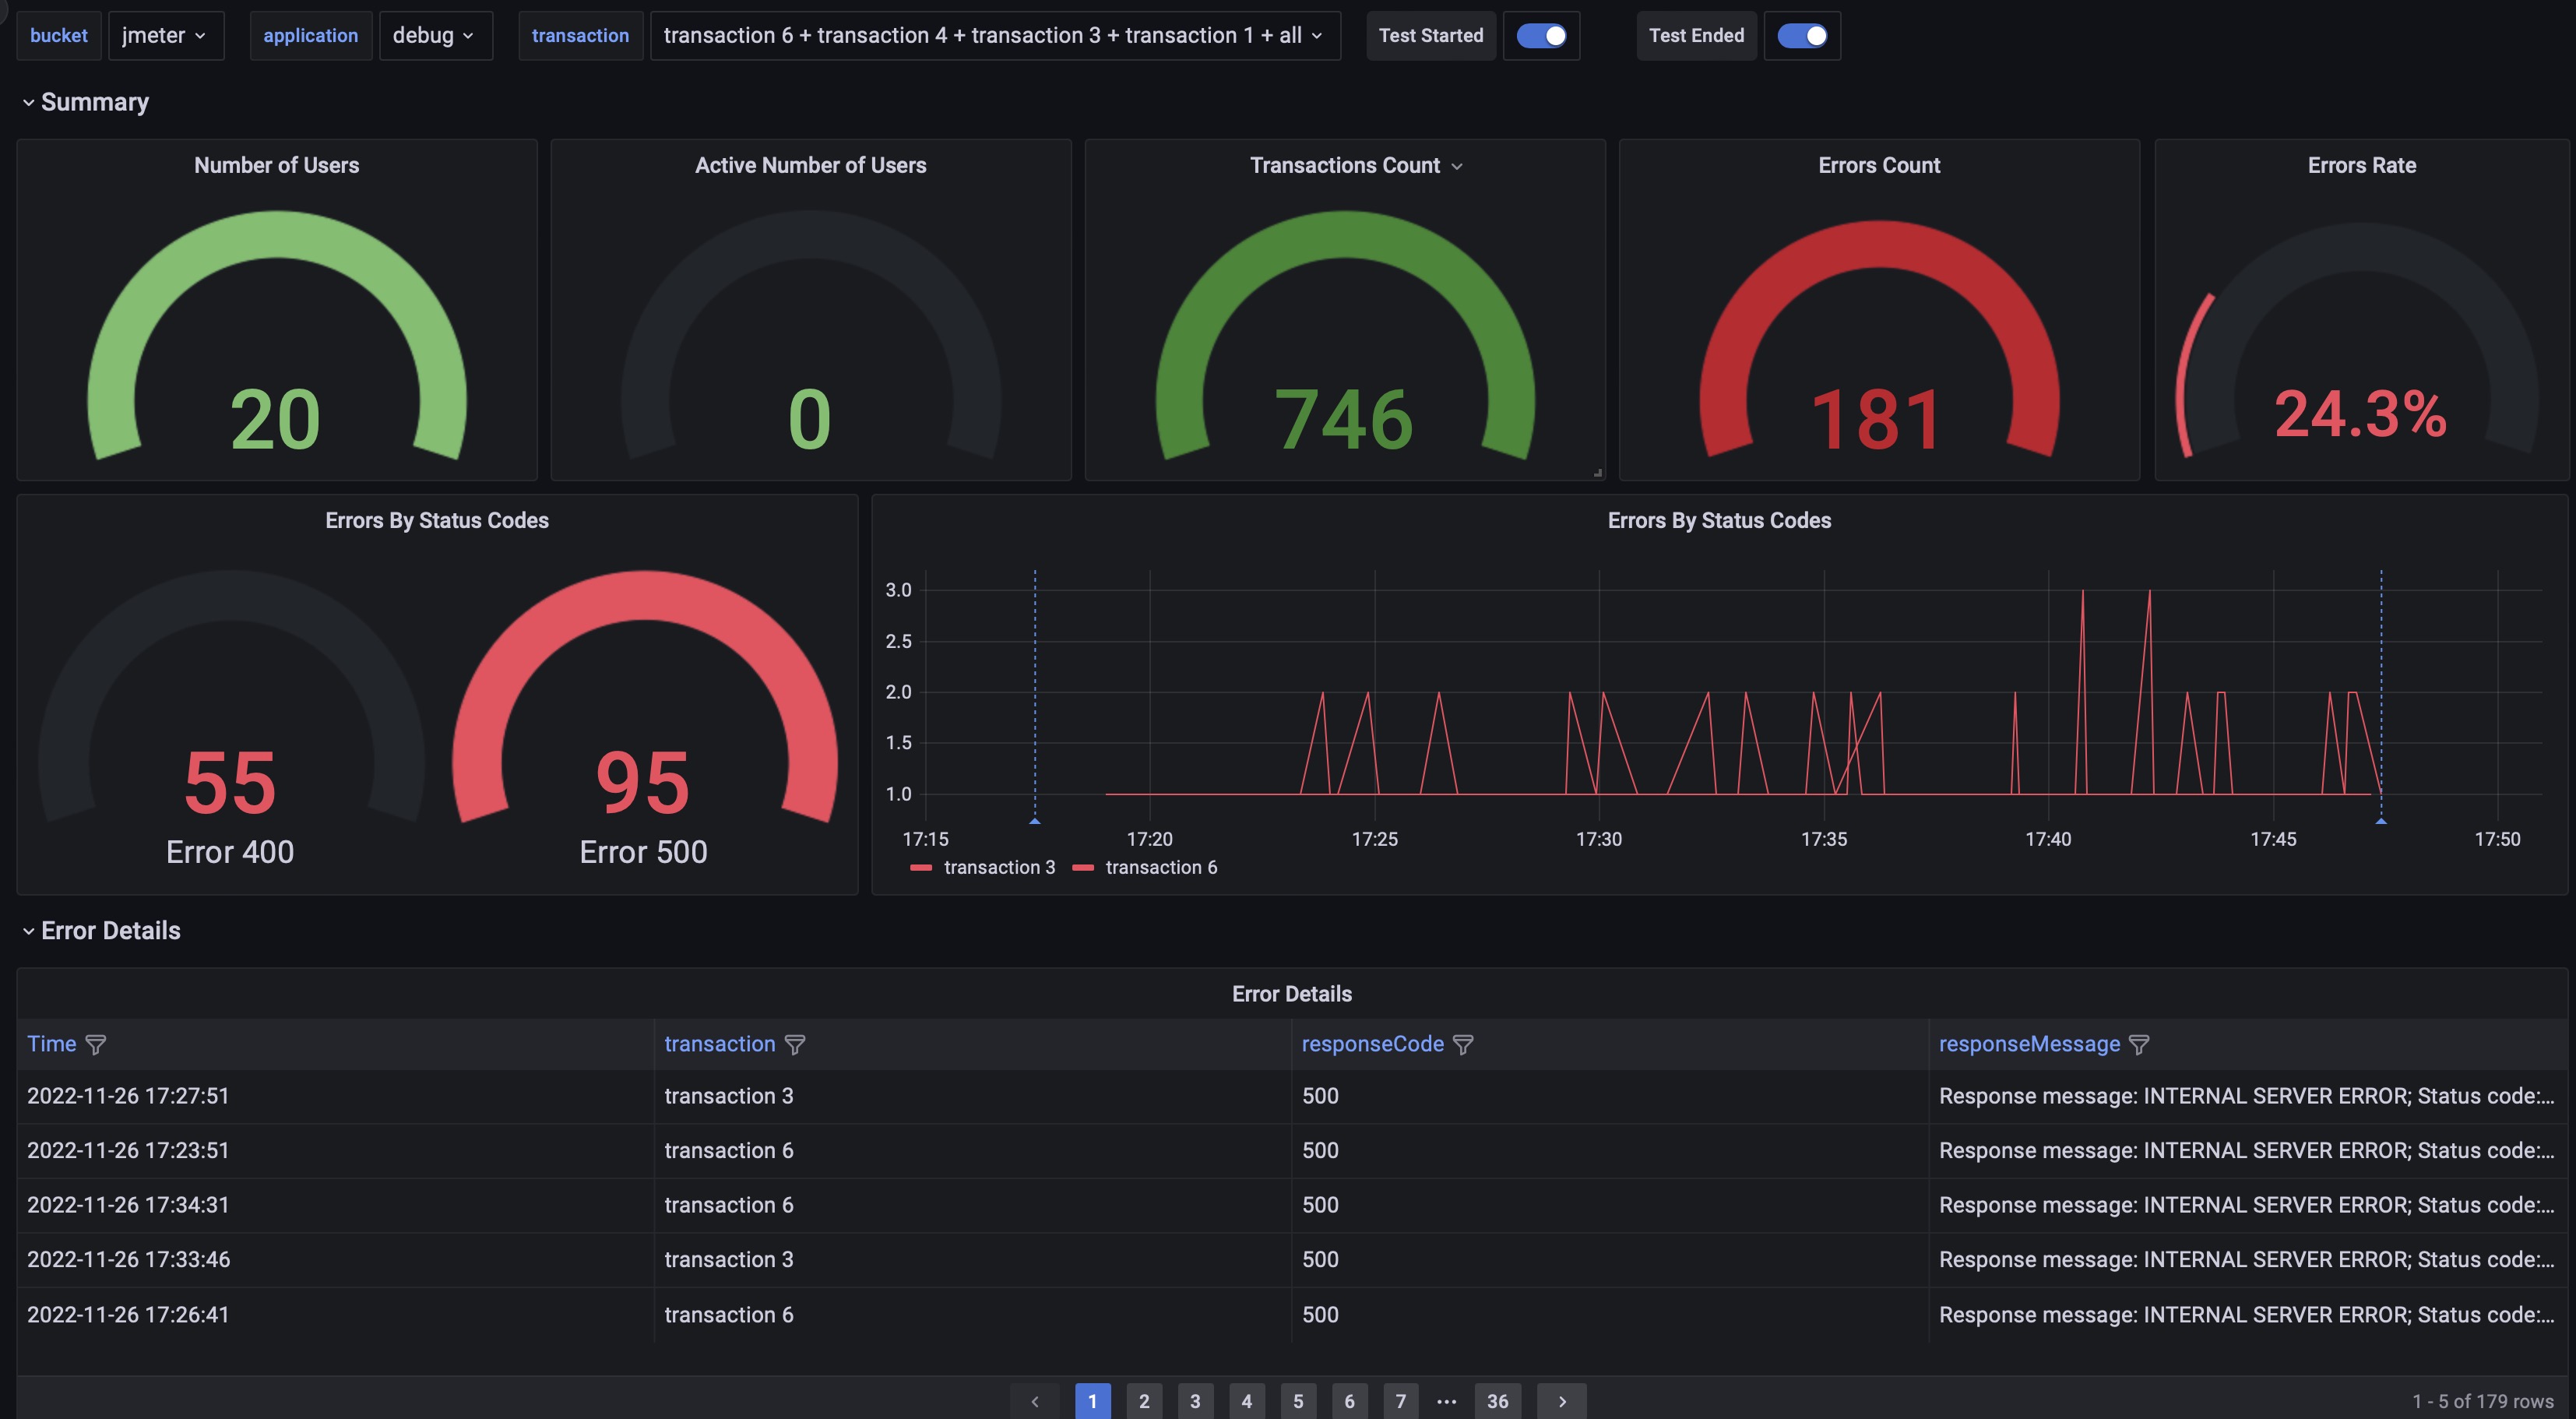
- Number of Users, the count of total threads
- Active Number of Users, the count of active threads
- Transactions Count
- Errors Count
- Errors Rate
- Errors By Status Codes
- Errors By Transaction
- Error Details, for failed transactions view the respose code and response message
Will need to add a JSR223 Listener to your JMeter script to capture the error details.
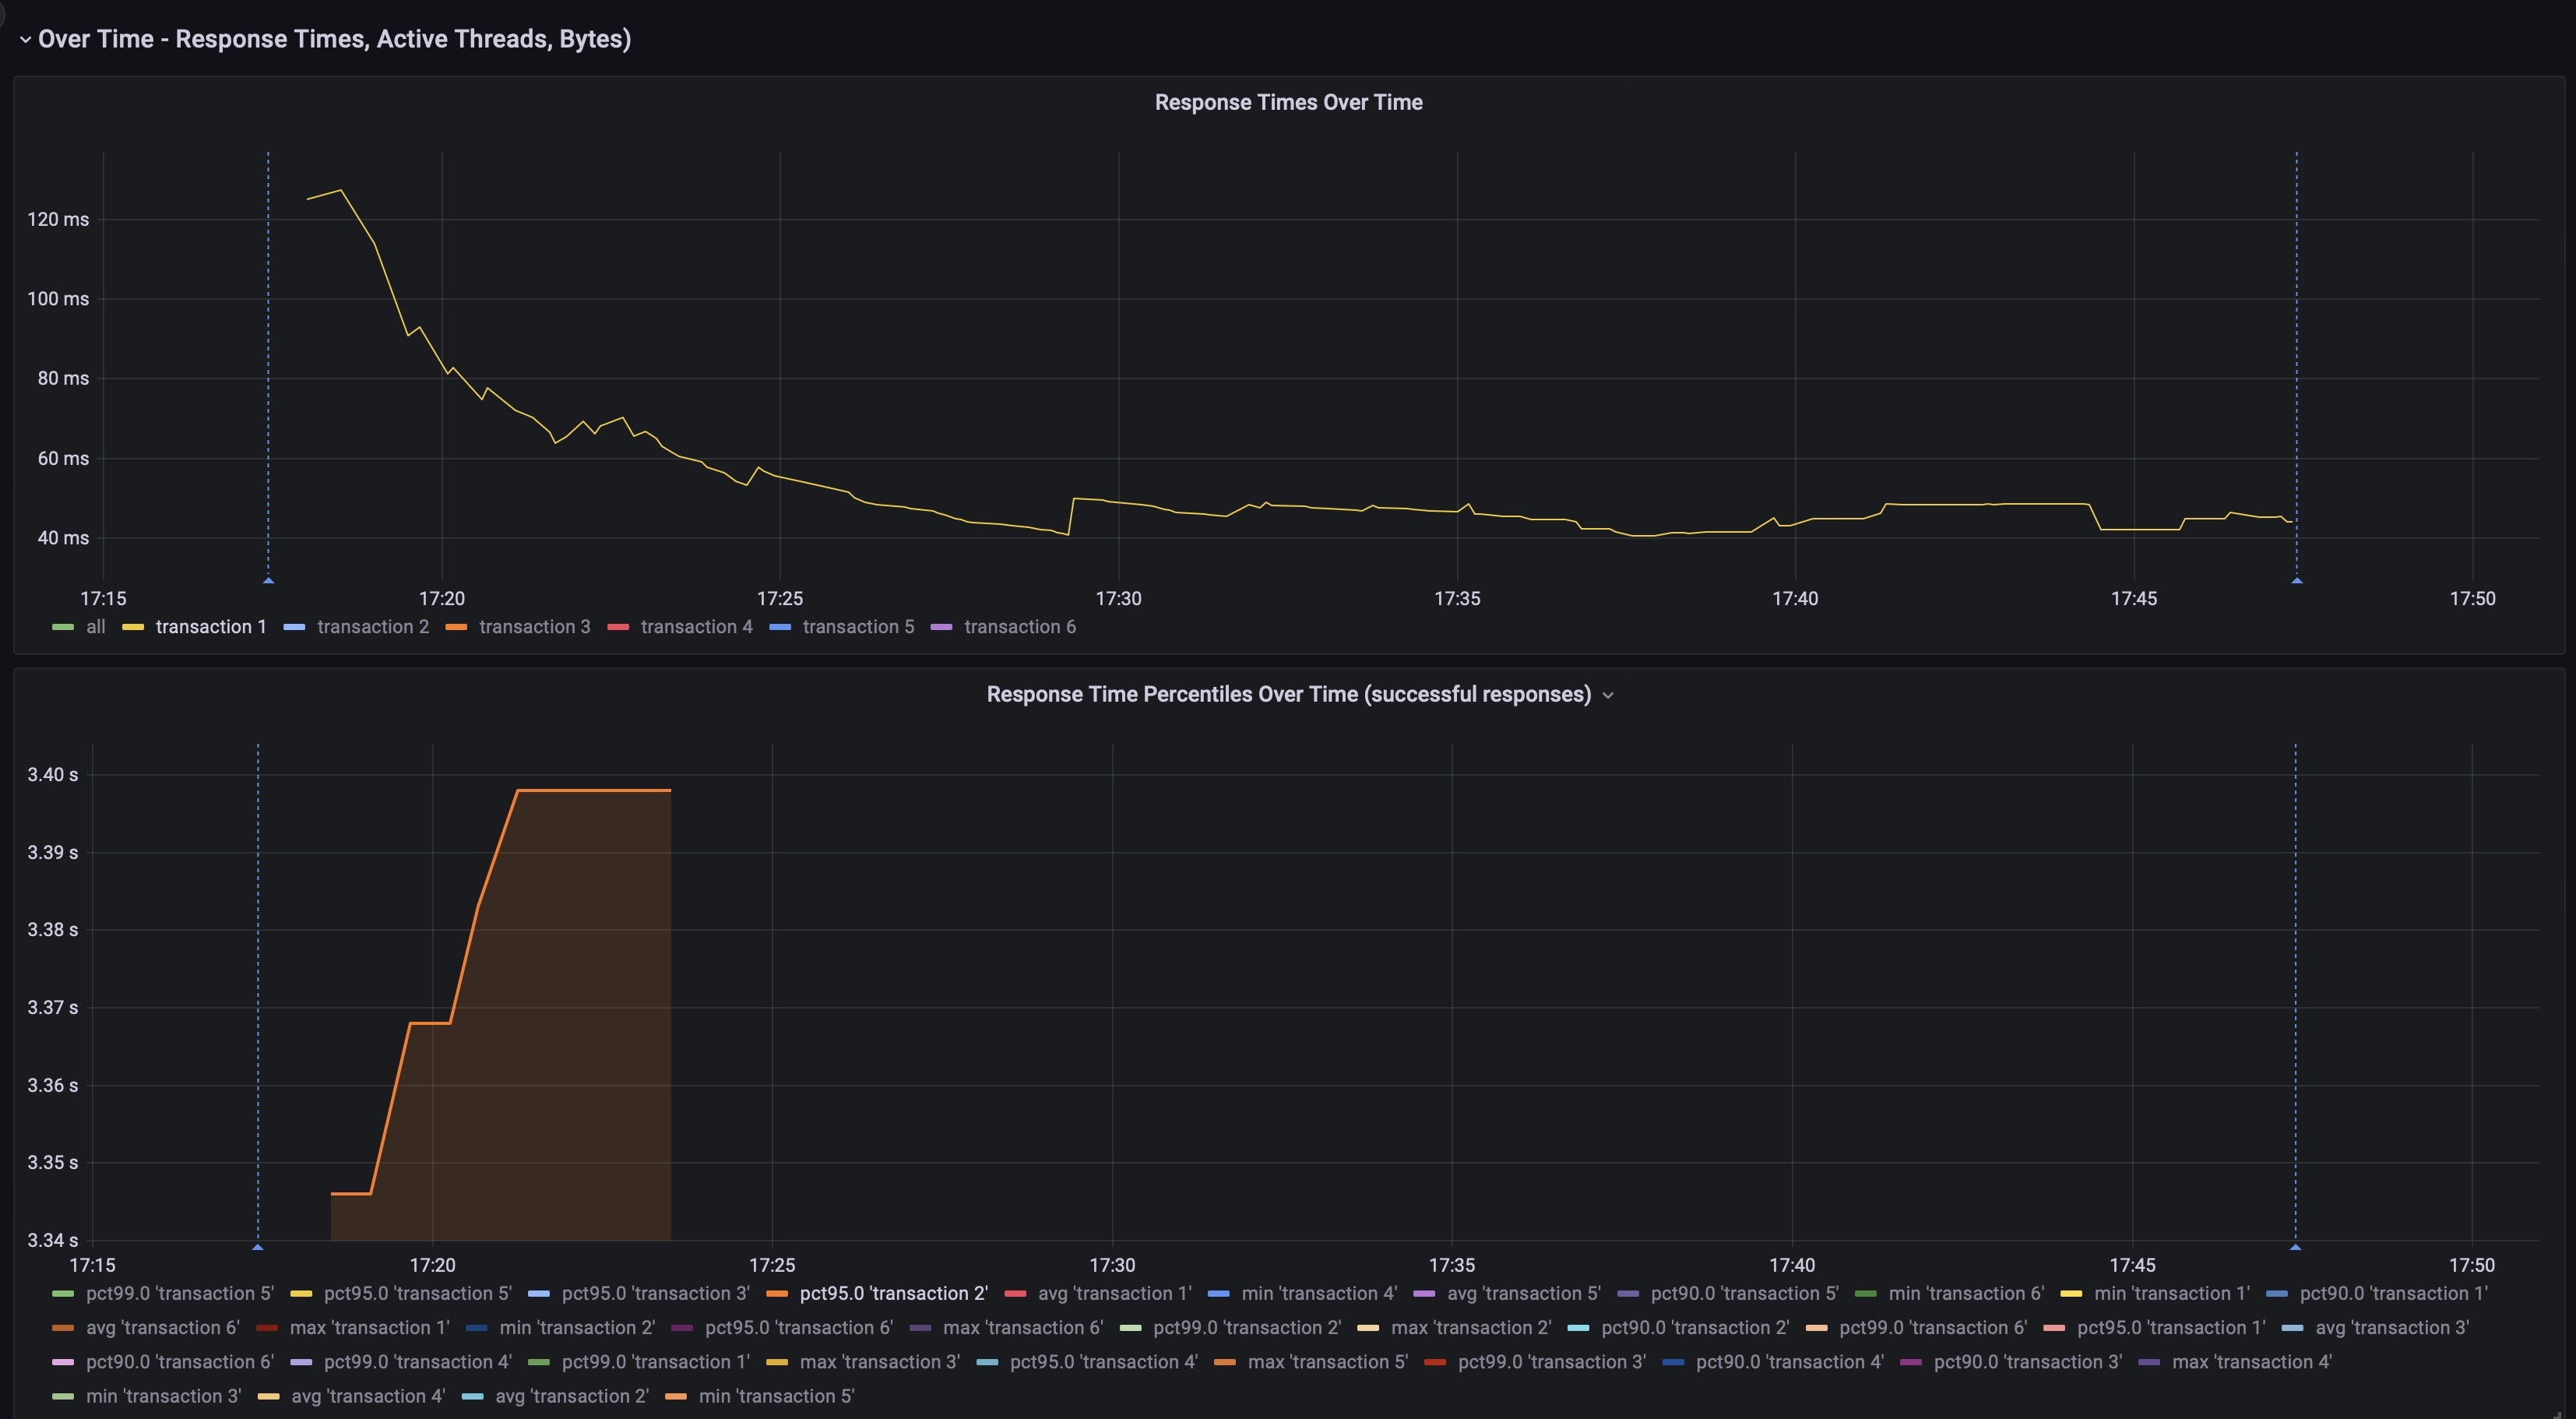
- Response Times Over Time
- Response Time Percentiles Over Time, view the percentiles configured in the listener, defaults to 99,95&90
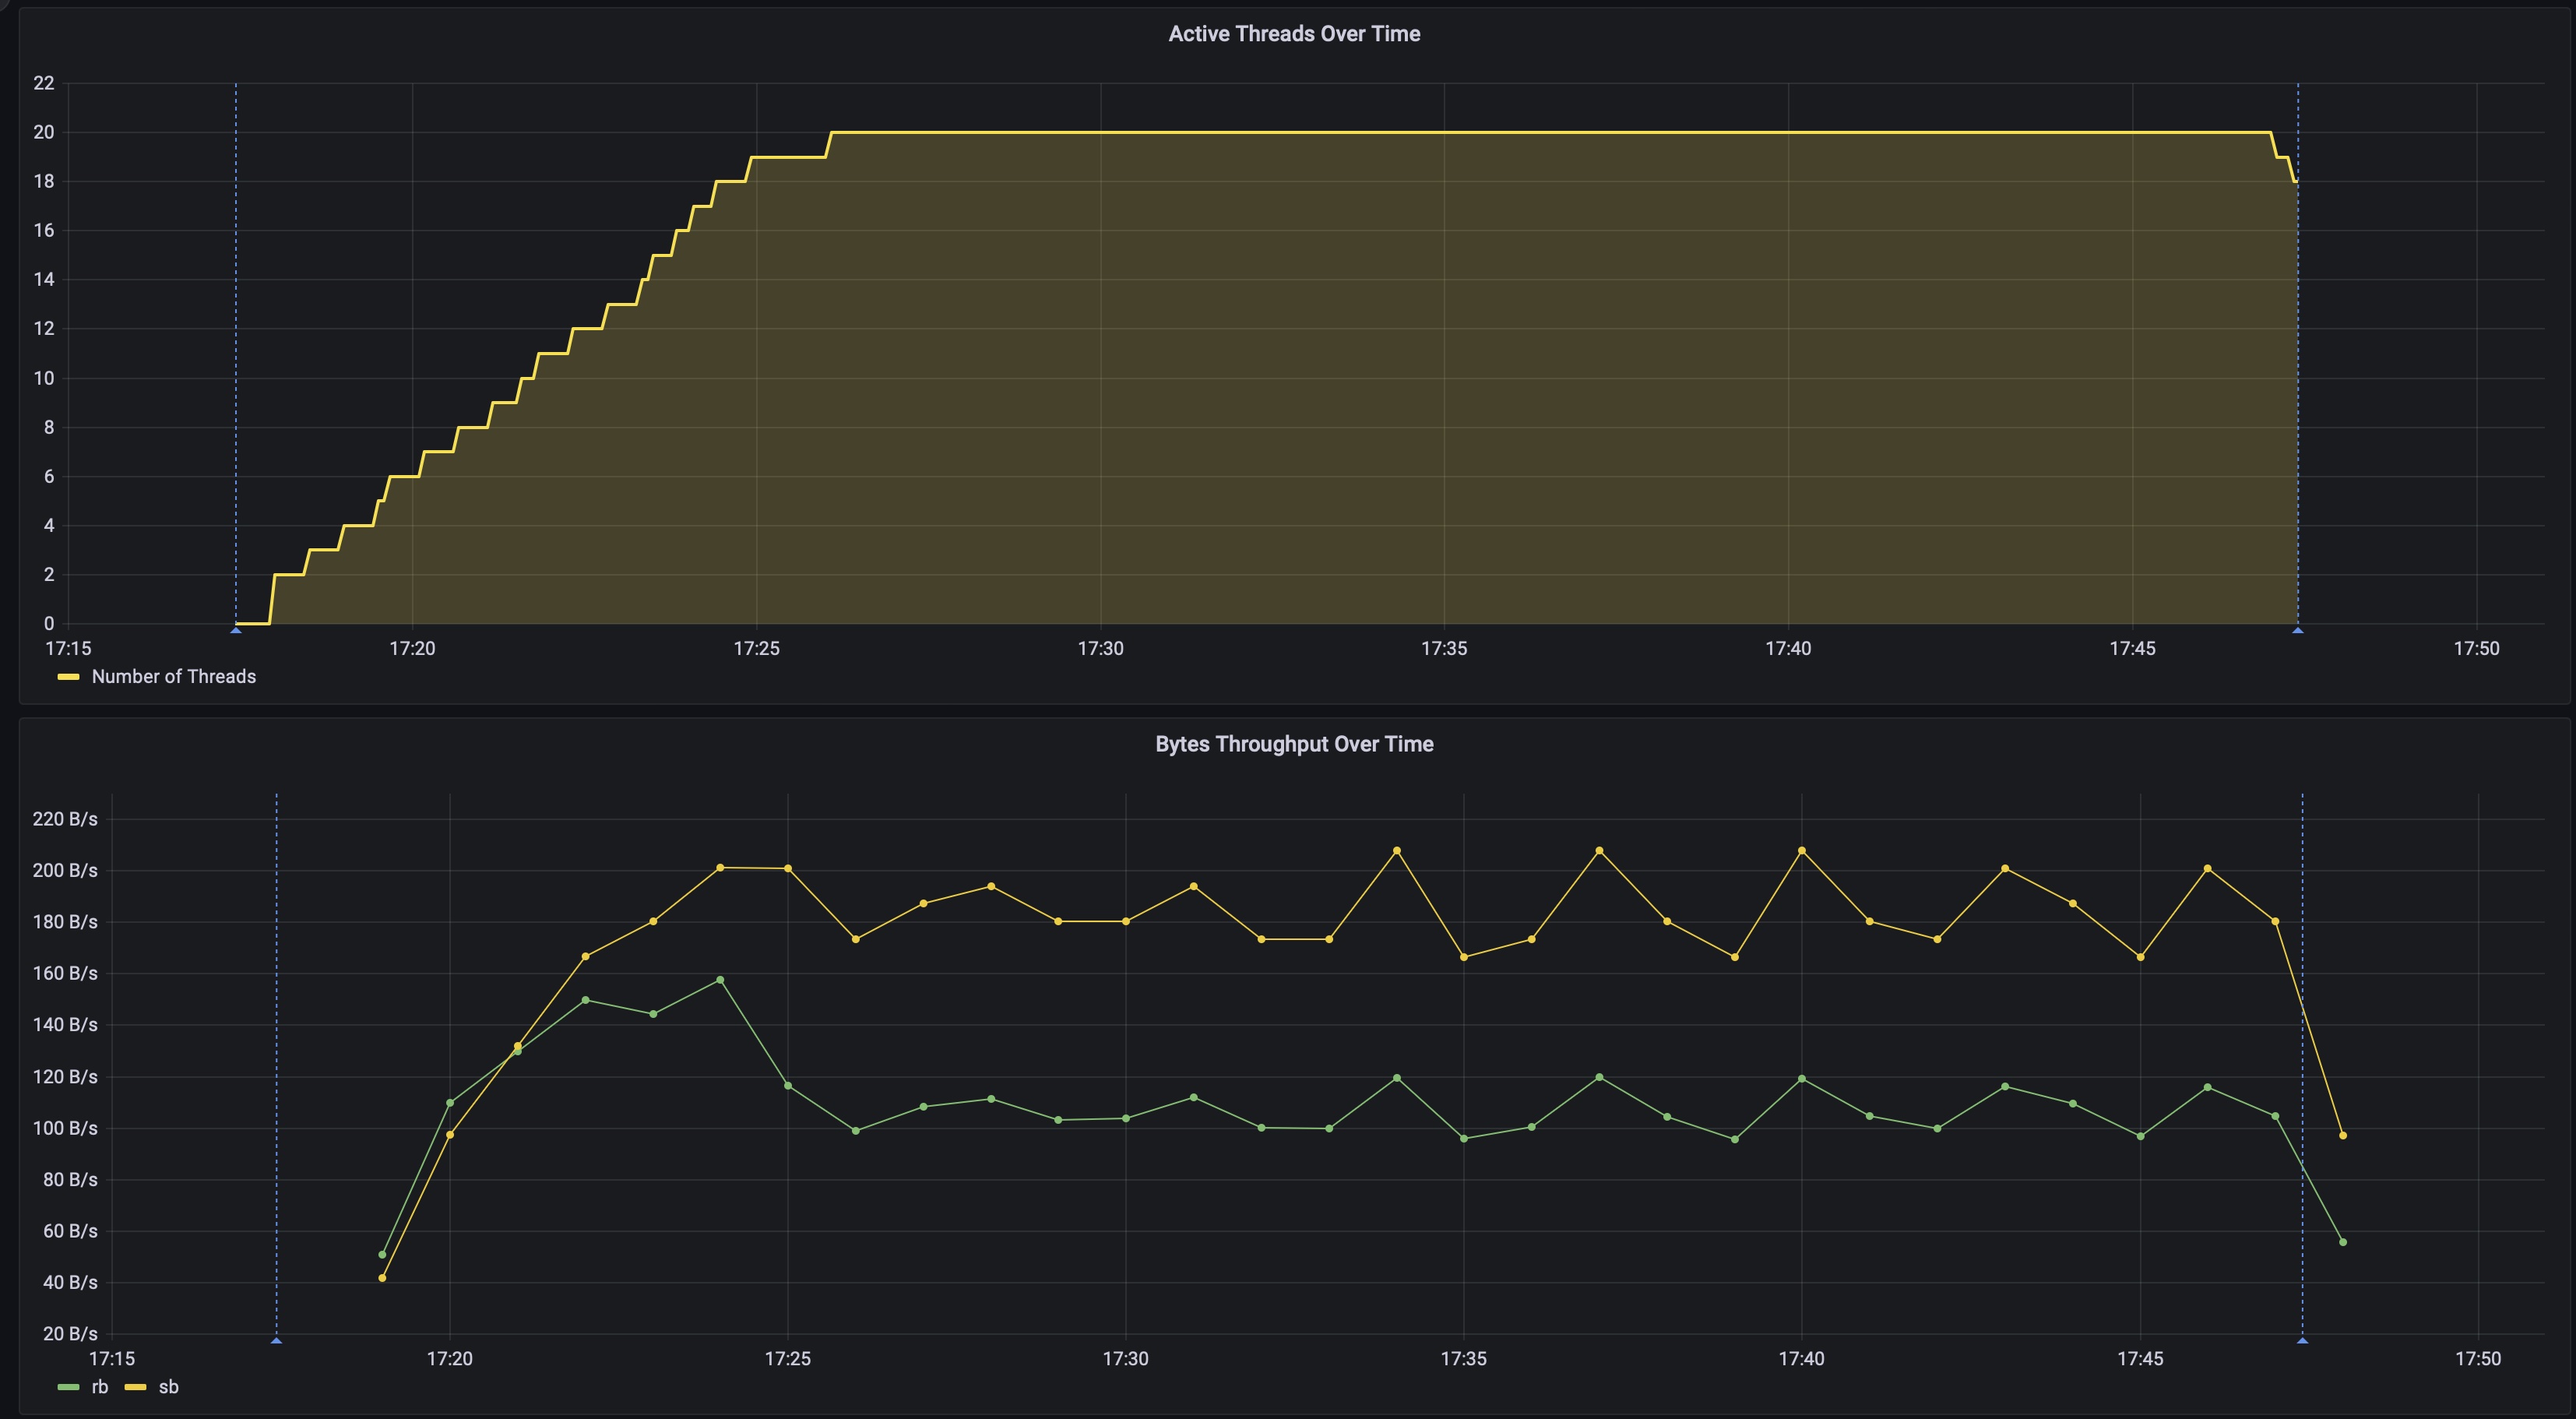
- Active Threads Over Time
- Bytes Throughput Over Time, bytes sent and received
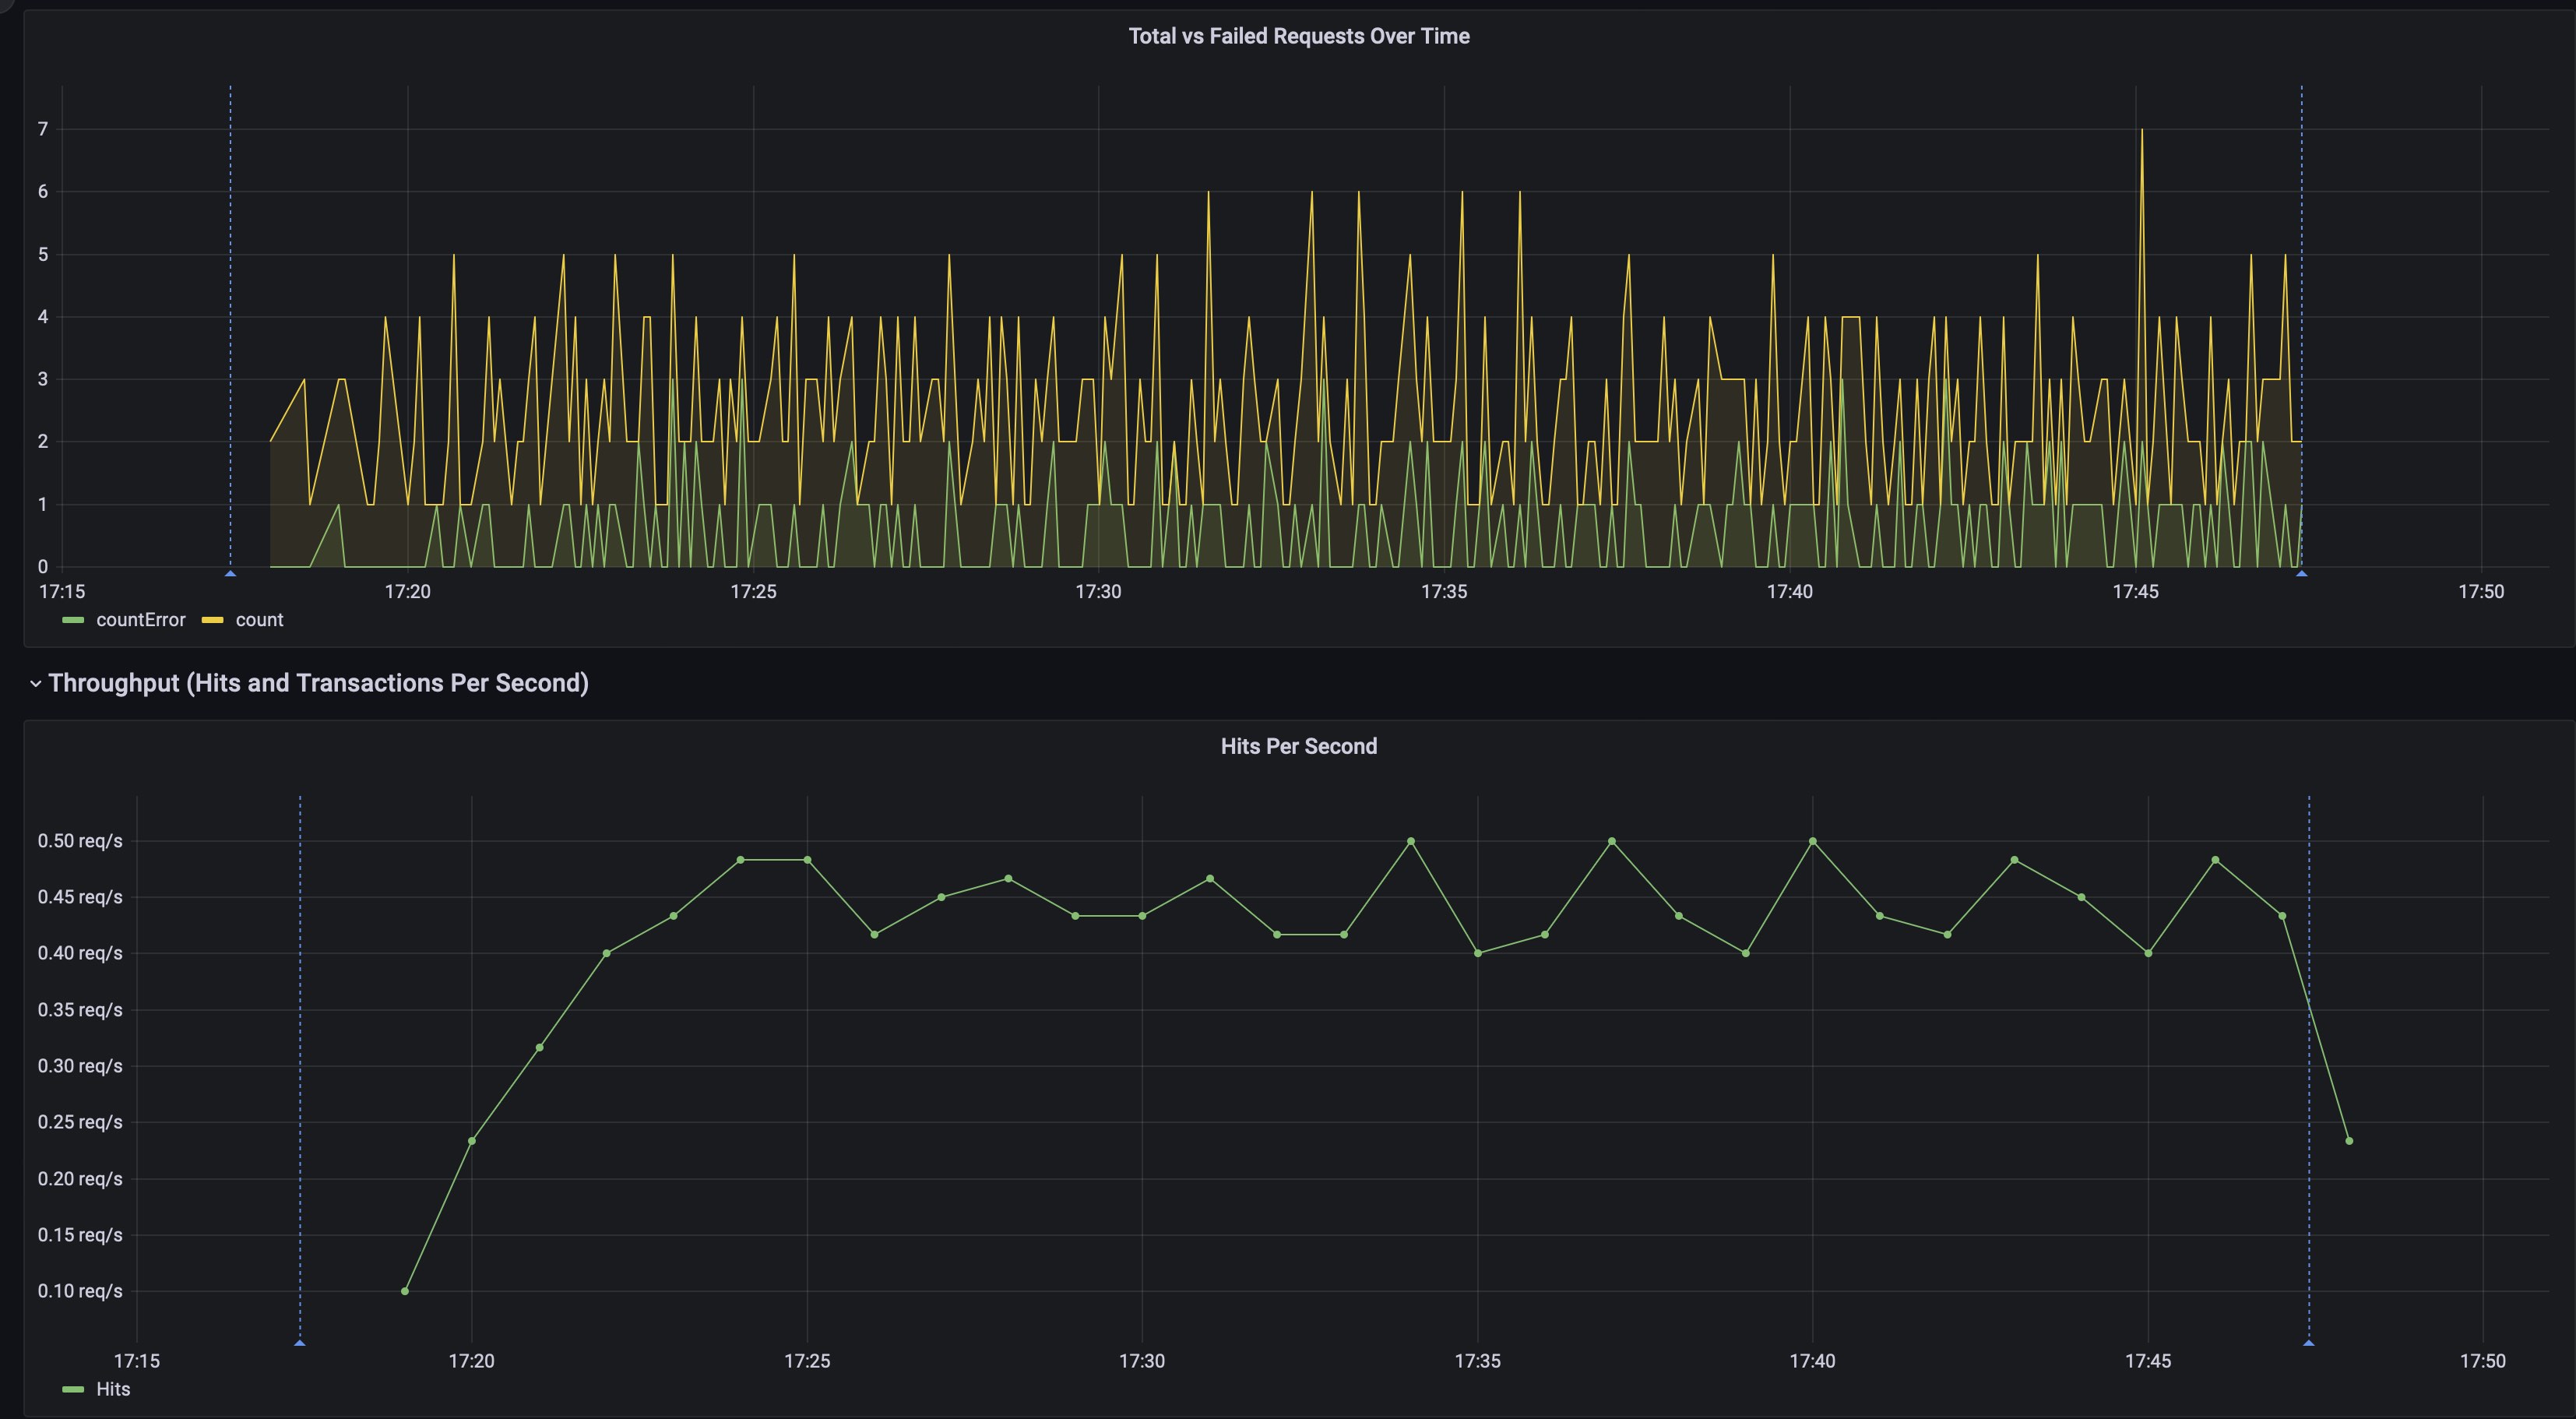
- Total vs Failed Requests Over Time
- Hits Per Second
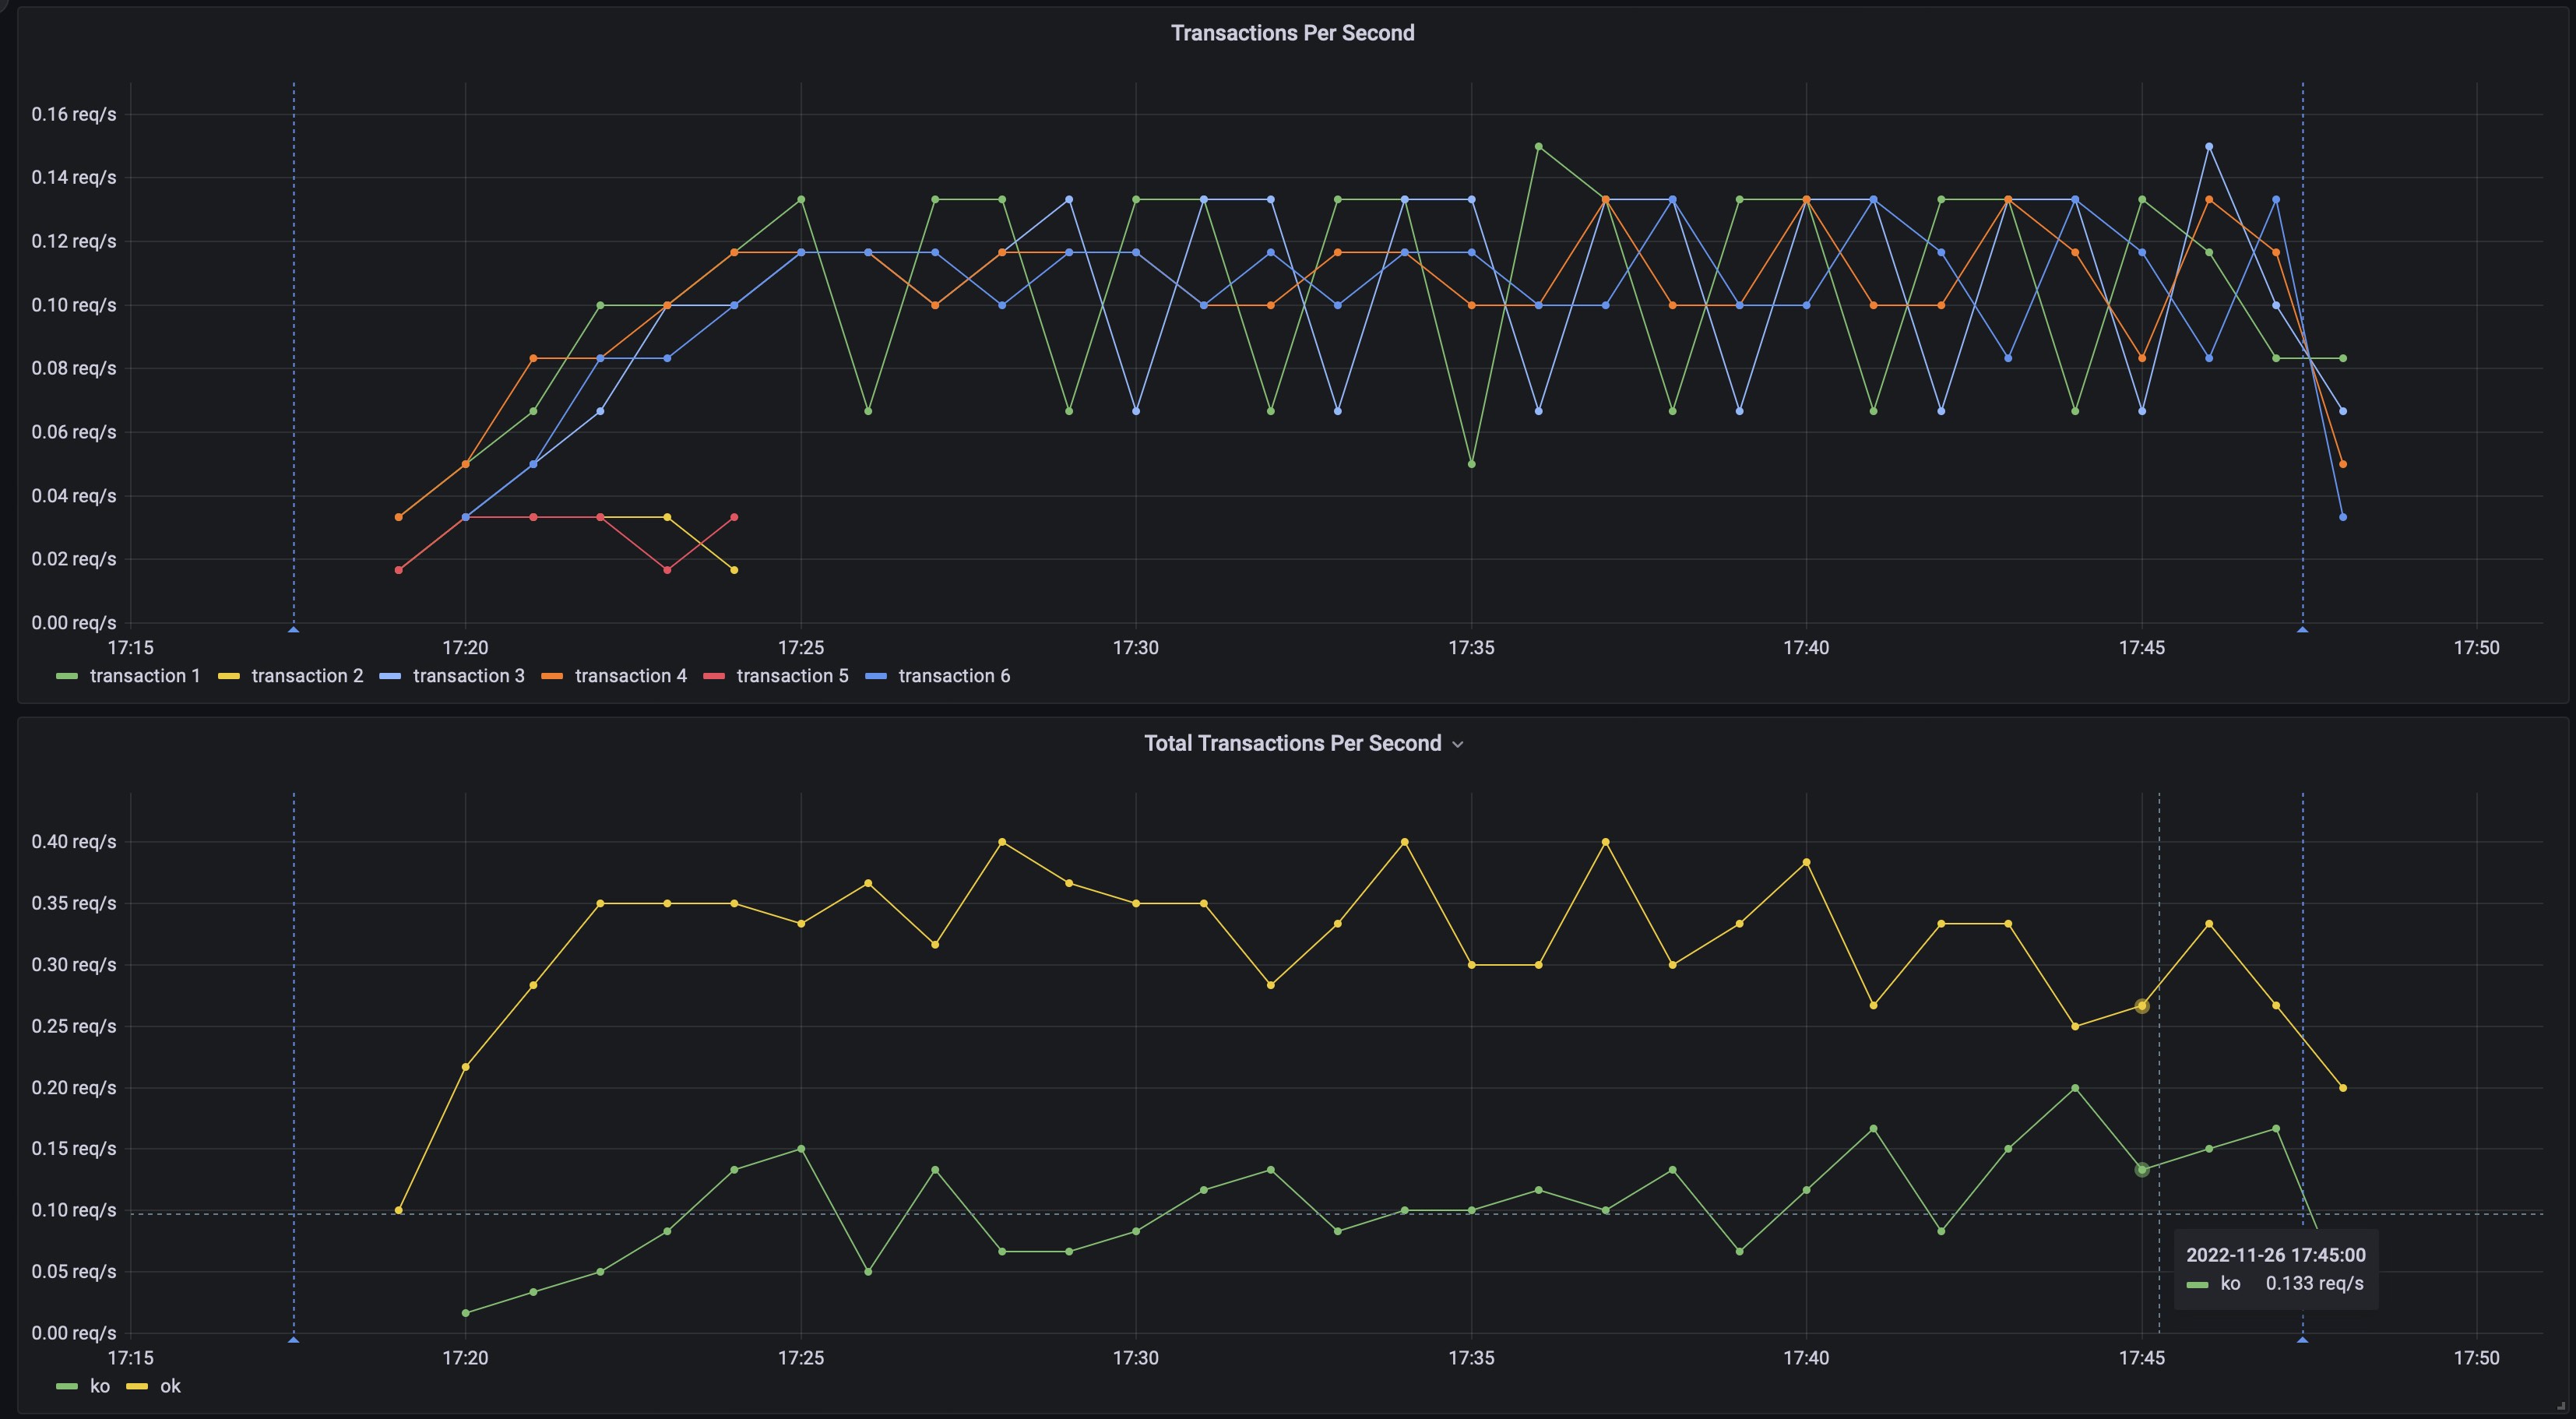
- Transactions Per Second
- Average Response Times per transaction, a repeat panel which will show the average response times for the transactions selected in the dropdown at the top of the dashboard
Data source config
Collector config:
Upload an updated version of an exported dashboard.json file from Grafana
| Revision | Description | Created | |
|---|---|---|---|
| Download |