Mastodon Stats
A comprehensive monitoring dashboard based on Mastodon's Prometheus statsd exporter
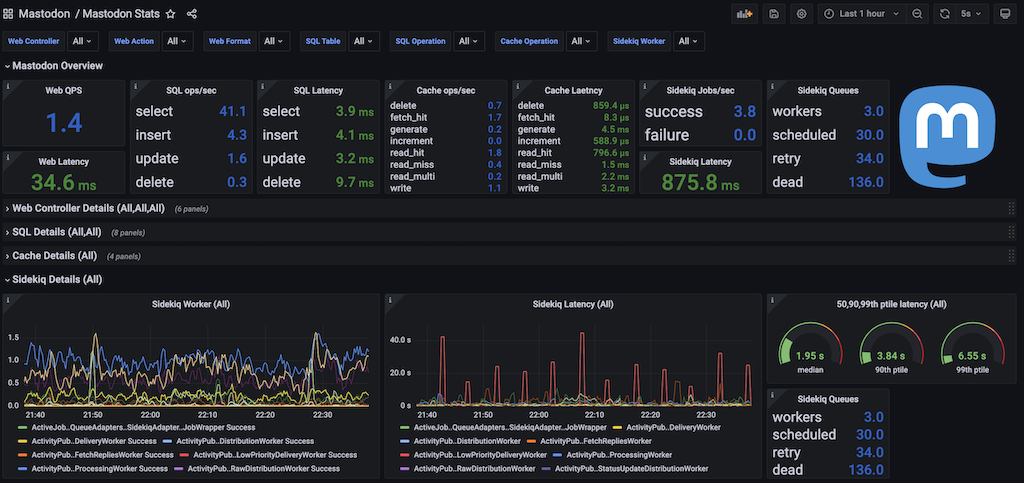
This dashboard shows all the internal statistics that Mastodon 4.0 provides. Thanks to the ability for Mastodon to export stats using the statsd protocol, they can be picked up by a Prometheus Statsd Exporter, read in by Prometheus, and visualized by this dashboard in Grafana!
NOTE: This dashboard requires a statsd mapping file to be installed in the prometheus statsd exporter. More information on configuring this (including the configuration file itself), can be found on IPng's website
Please follow and reach out to @IPngNetworks@ublog.tech on Mastodon to discuss!
Data source config
Collector type:
Collector plugins:
Collector config:
Revisions
Upload an updated version of an exported dashboard.json file from Grafana
| Revision | Description | Created | |
|---|---|---|---|
| Download |