JMeter test results influxdb2 custom backend listener
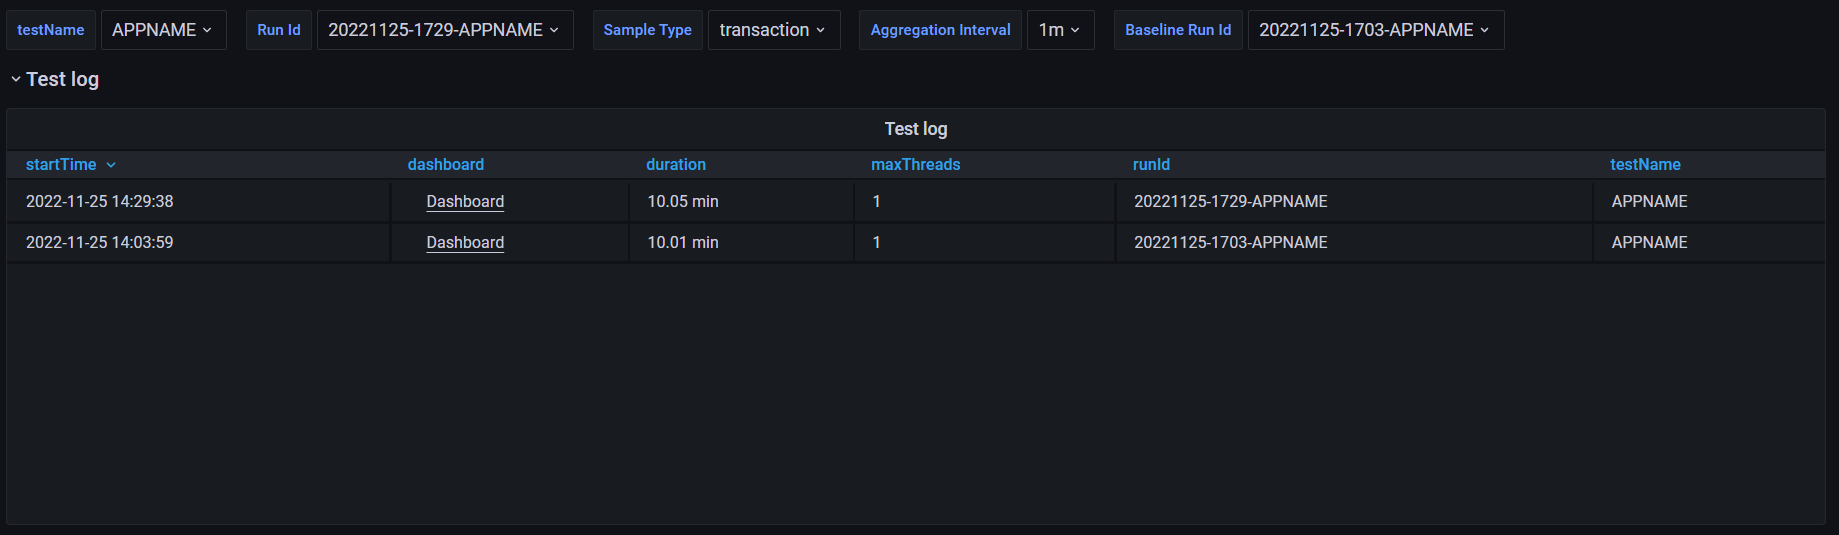
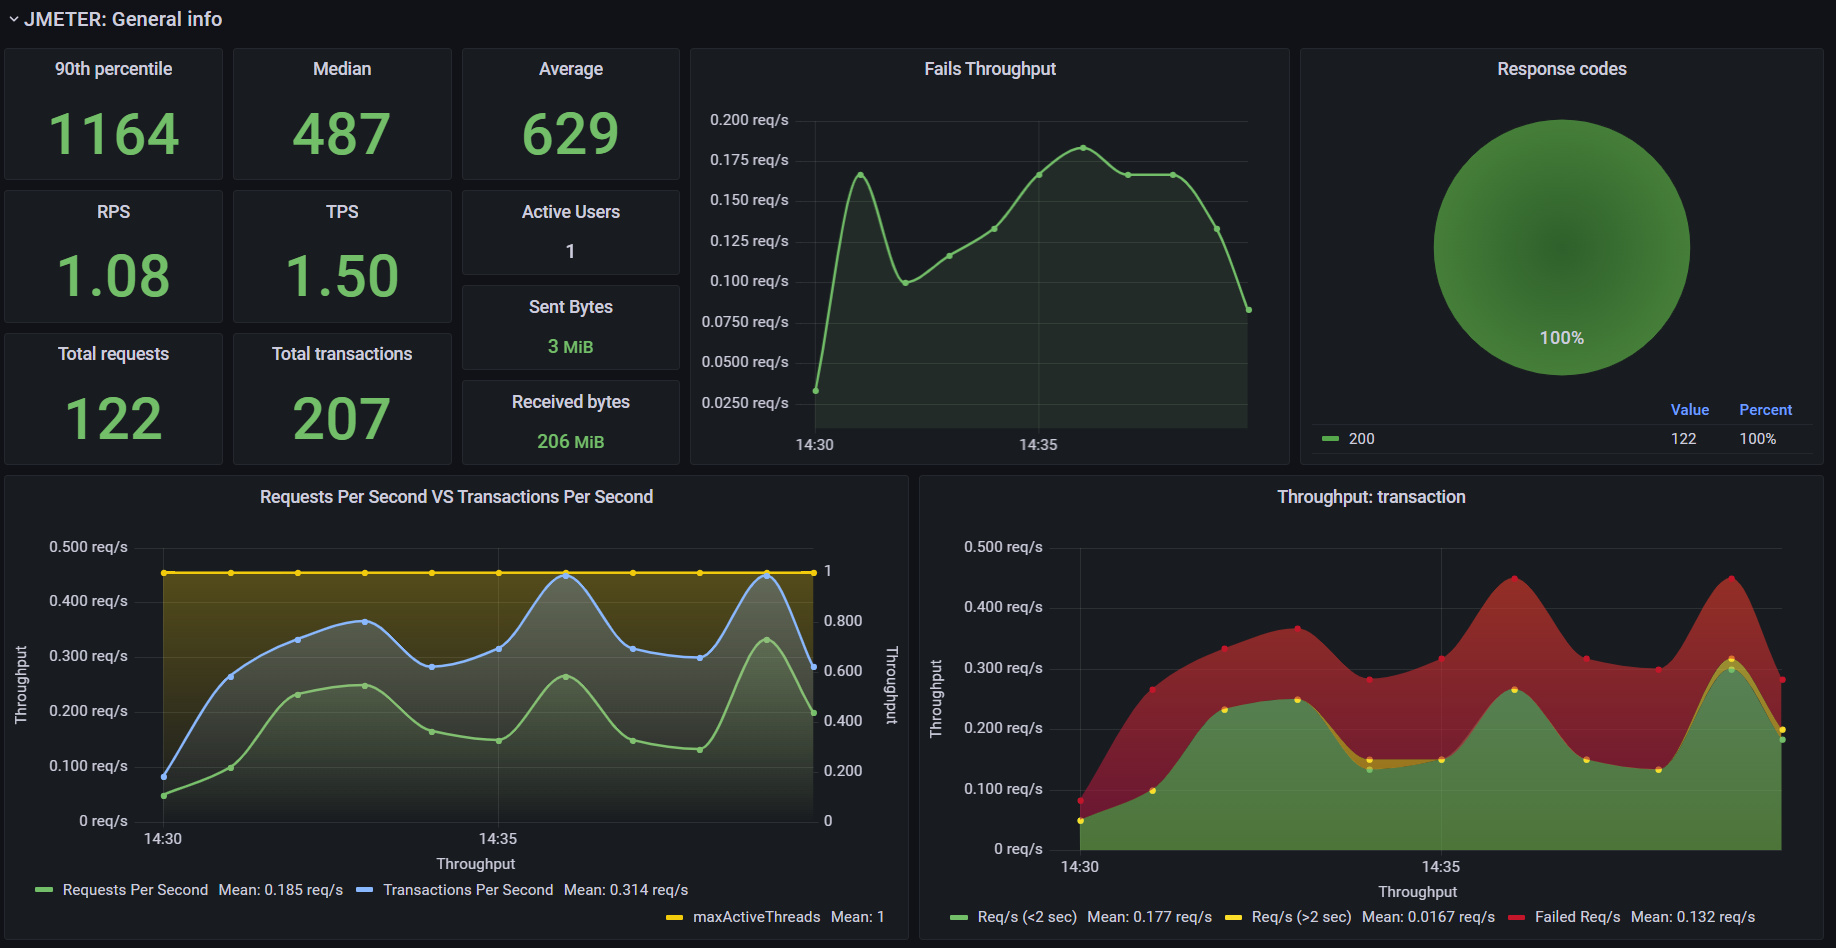
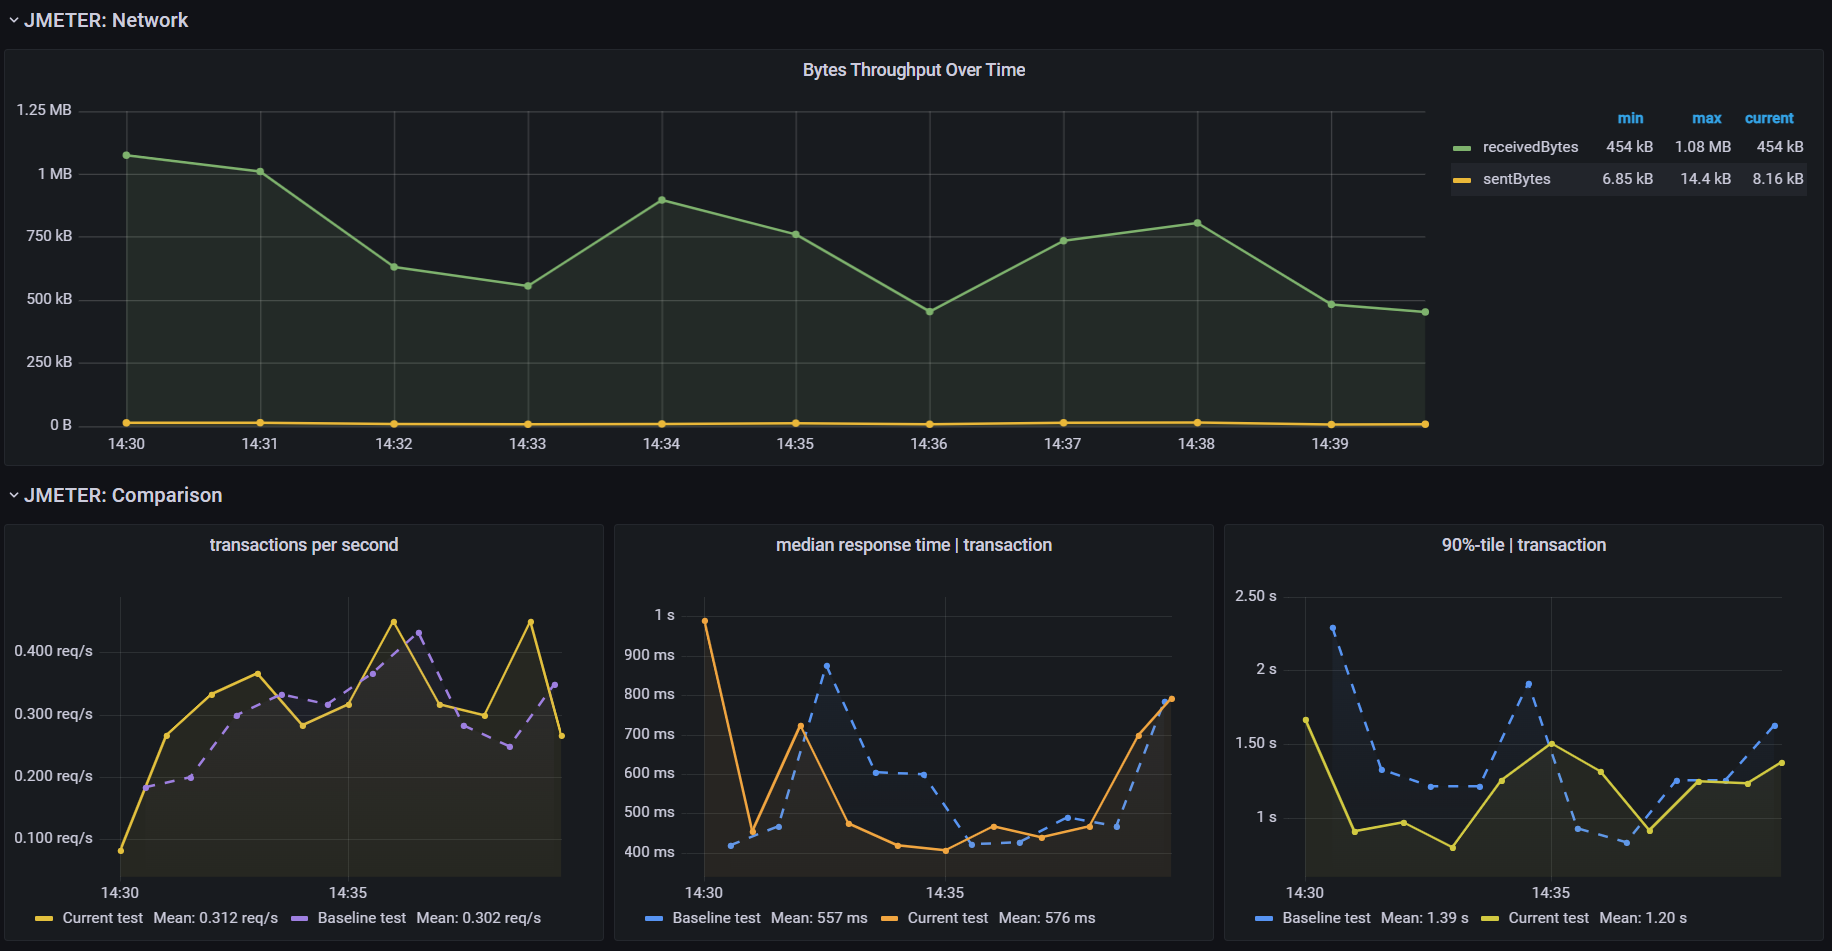
This dashboard shows live load test metrics provided by JMeter
How to configure:
- Create new InfluxDB Bucket and Token
- Download custom plugin to JMeter /lib/ext folder from git
- Configure JMeter backend listener
   - Backend listener implementation: io.github.mderevyankoaqa.visualizer.InfluxDatabaseBackendListenerClient
   - testName: YOUR_APP_NAME
   - nodeName: YOU_NODE_NAME (Example: ${__machineName})
   - runId: YOUR_TEST_ID (For example: ${__time(yyyyMMdd-HHmm)}-appname)
   - influxDBURL: http://YOUR_INFLUXDB_IP:8086/
   - influxDBToken: YOUR_TOKEN
   - influxDBOrganization: YOUR_ORG
   - influxDBBucket: jmeter
   - samplersList: .*
   - useRegexForSamplerList: true
   - recordSubSamples: false
   - saveResponseBodyOfFailures: true
- Add InfluxDB as a data source in Grafana using your bucket and token.
- Create a folder for your project if it doesn't already exist
- Import Grafana dashboard
Data source config
Collector type:
Collector plugins:
Collector config:
Revisions
Upload an updated version of an exported dashboard.json file from Grafana
| Revision | Description | Created | |
|---|---|---|---|
| Download |