Standard Cluster Monitoring
Standard Kubernetes/OpenShift cluster monitoring dashboard (needs Prometheus recording rules)
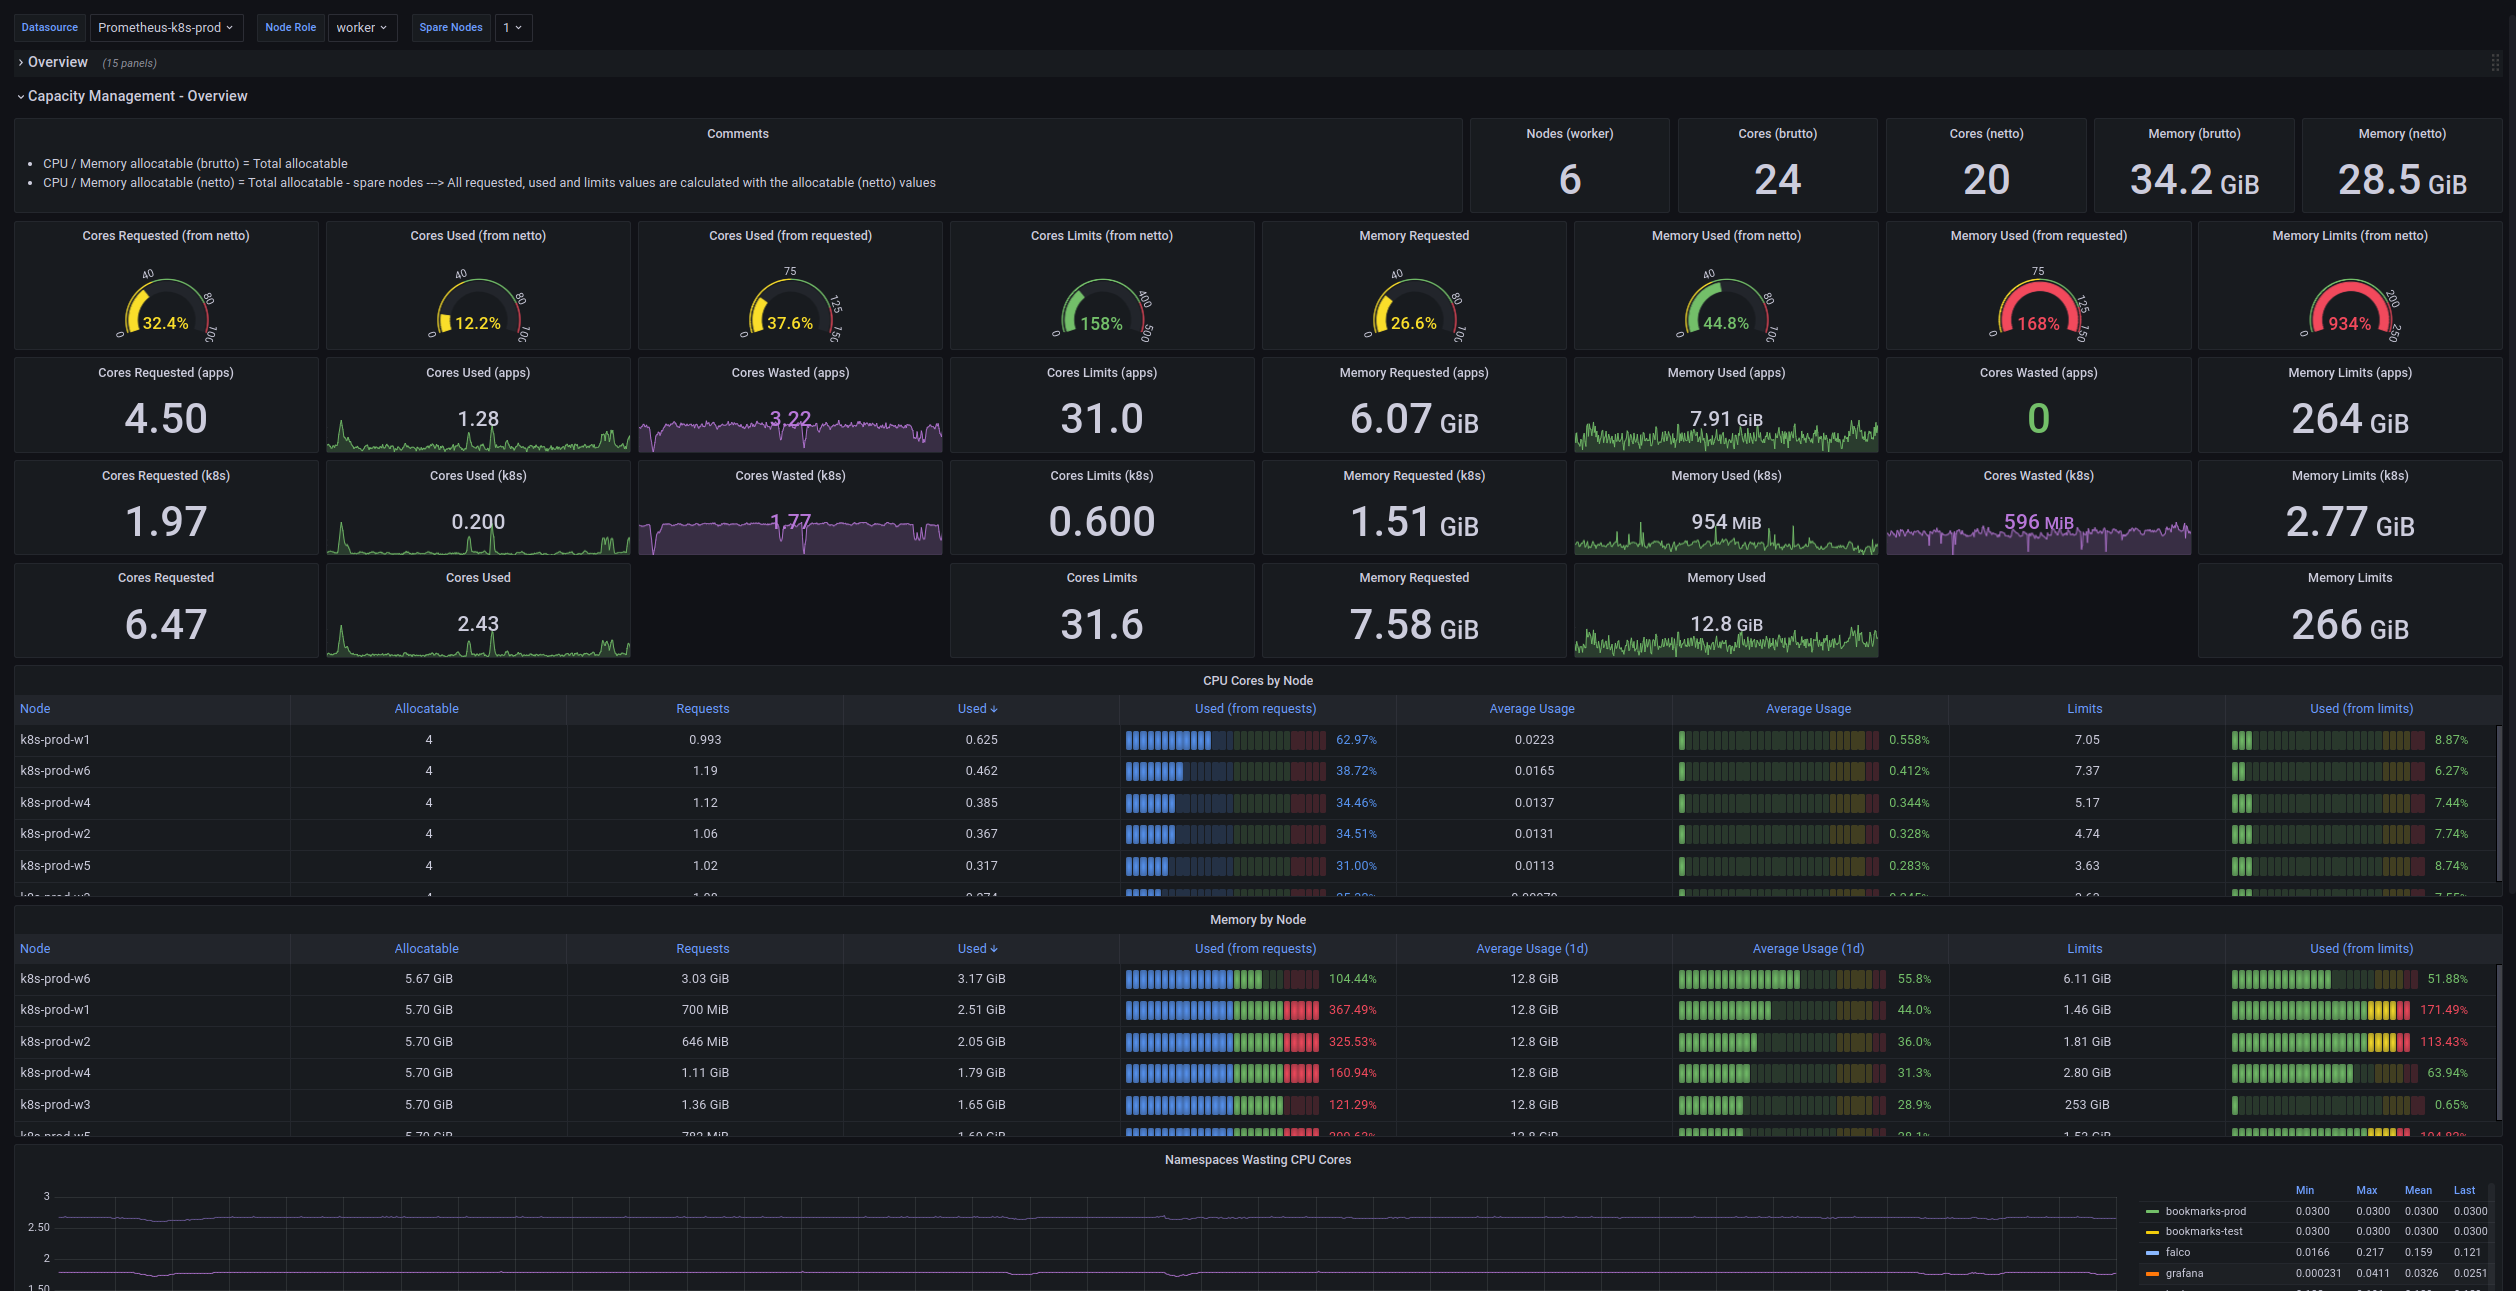
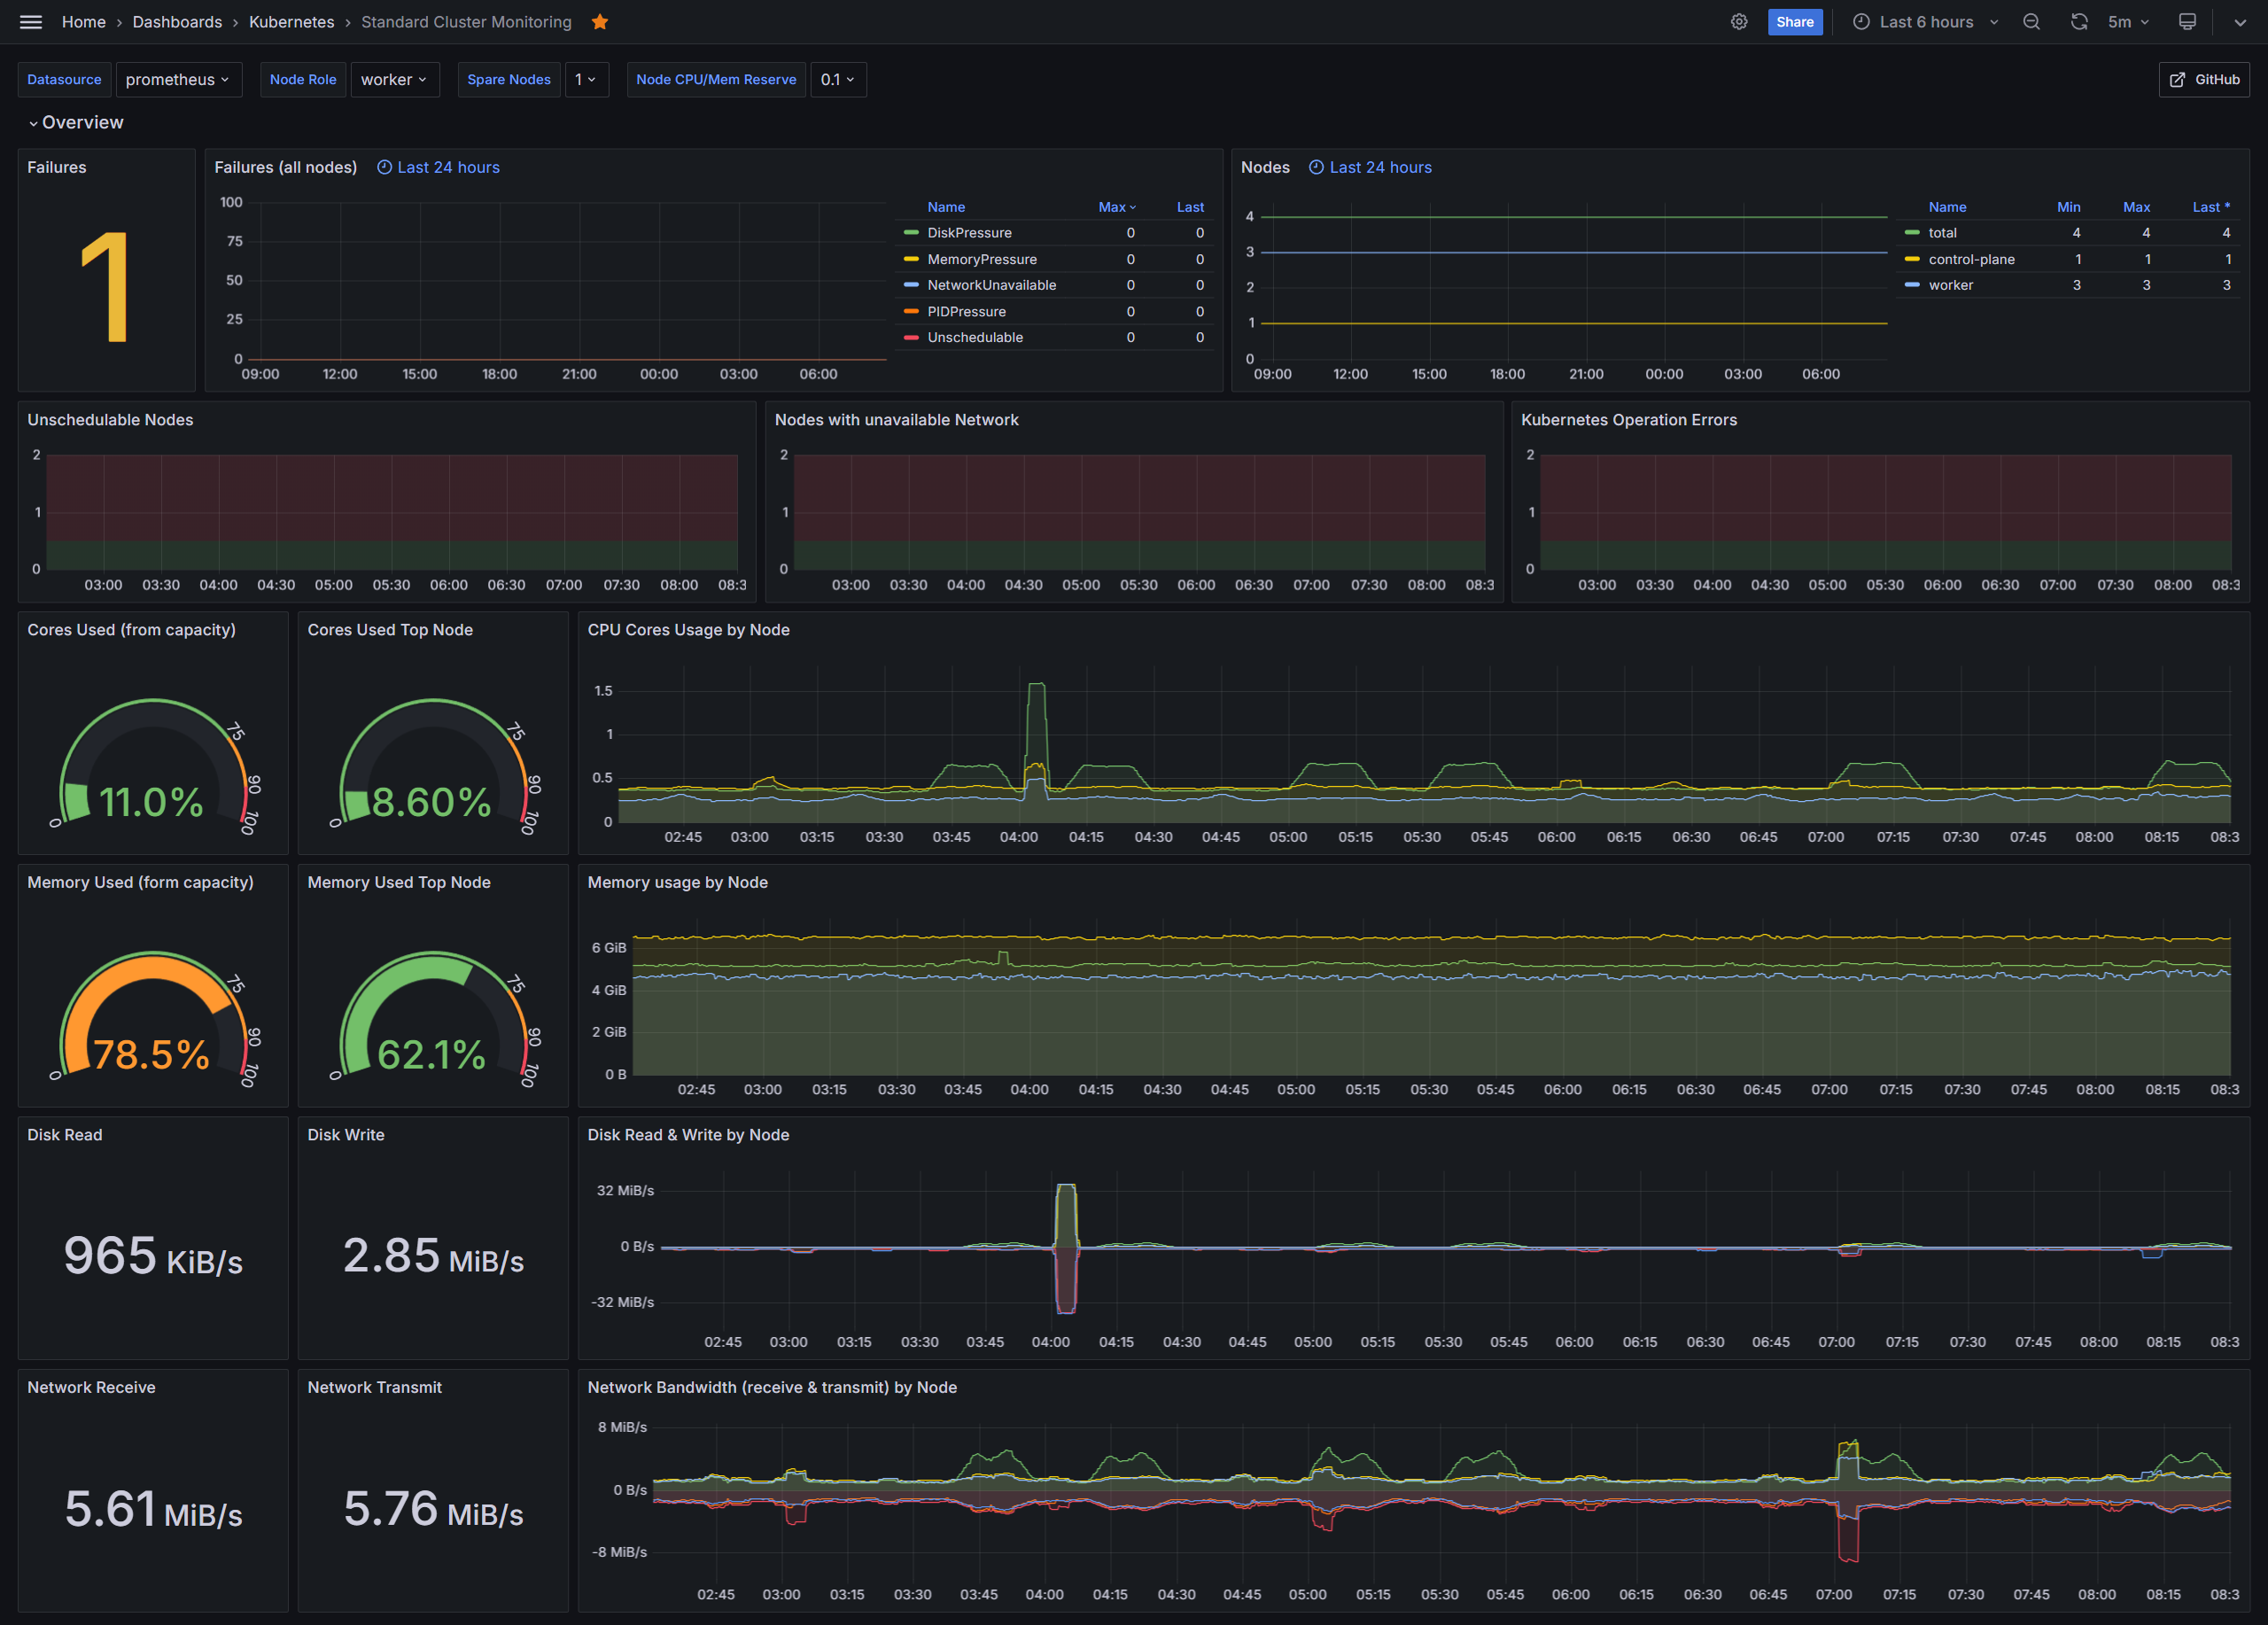
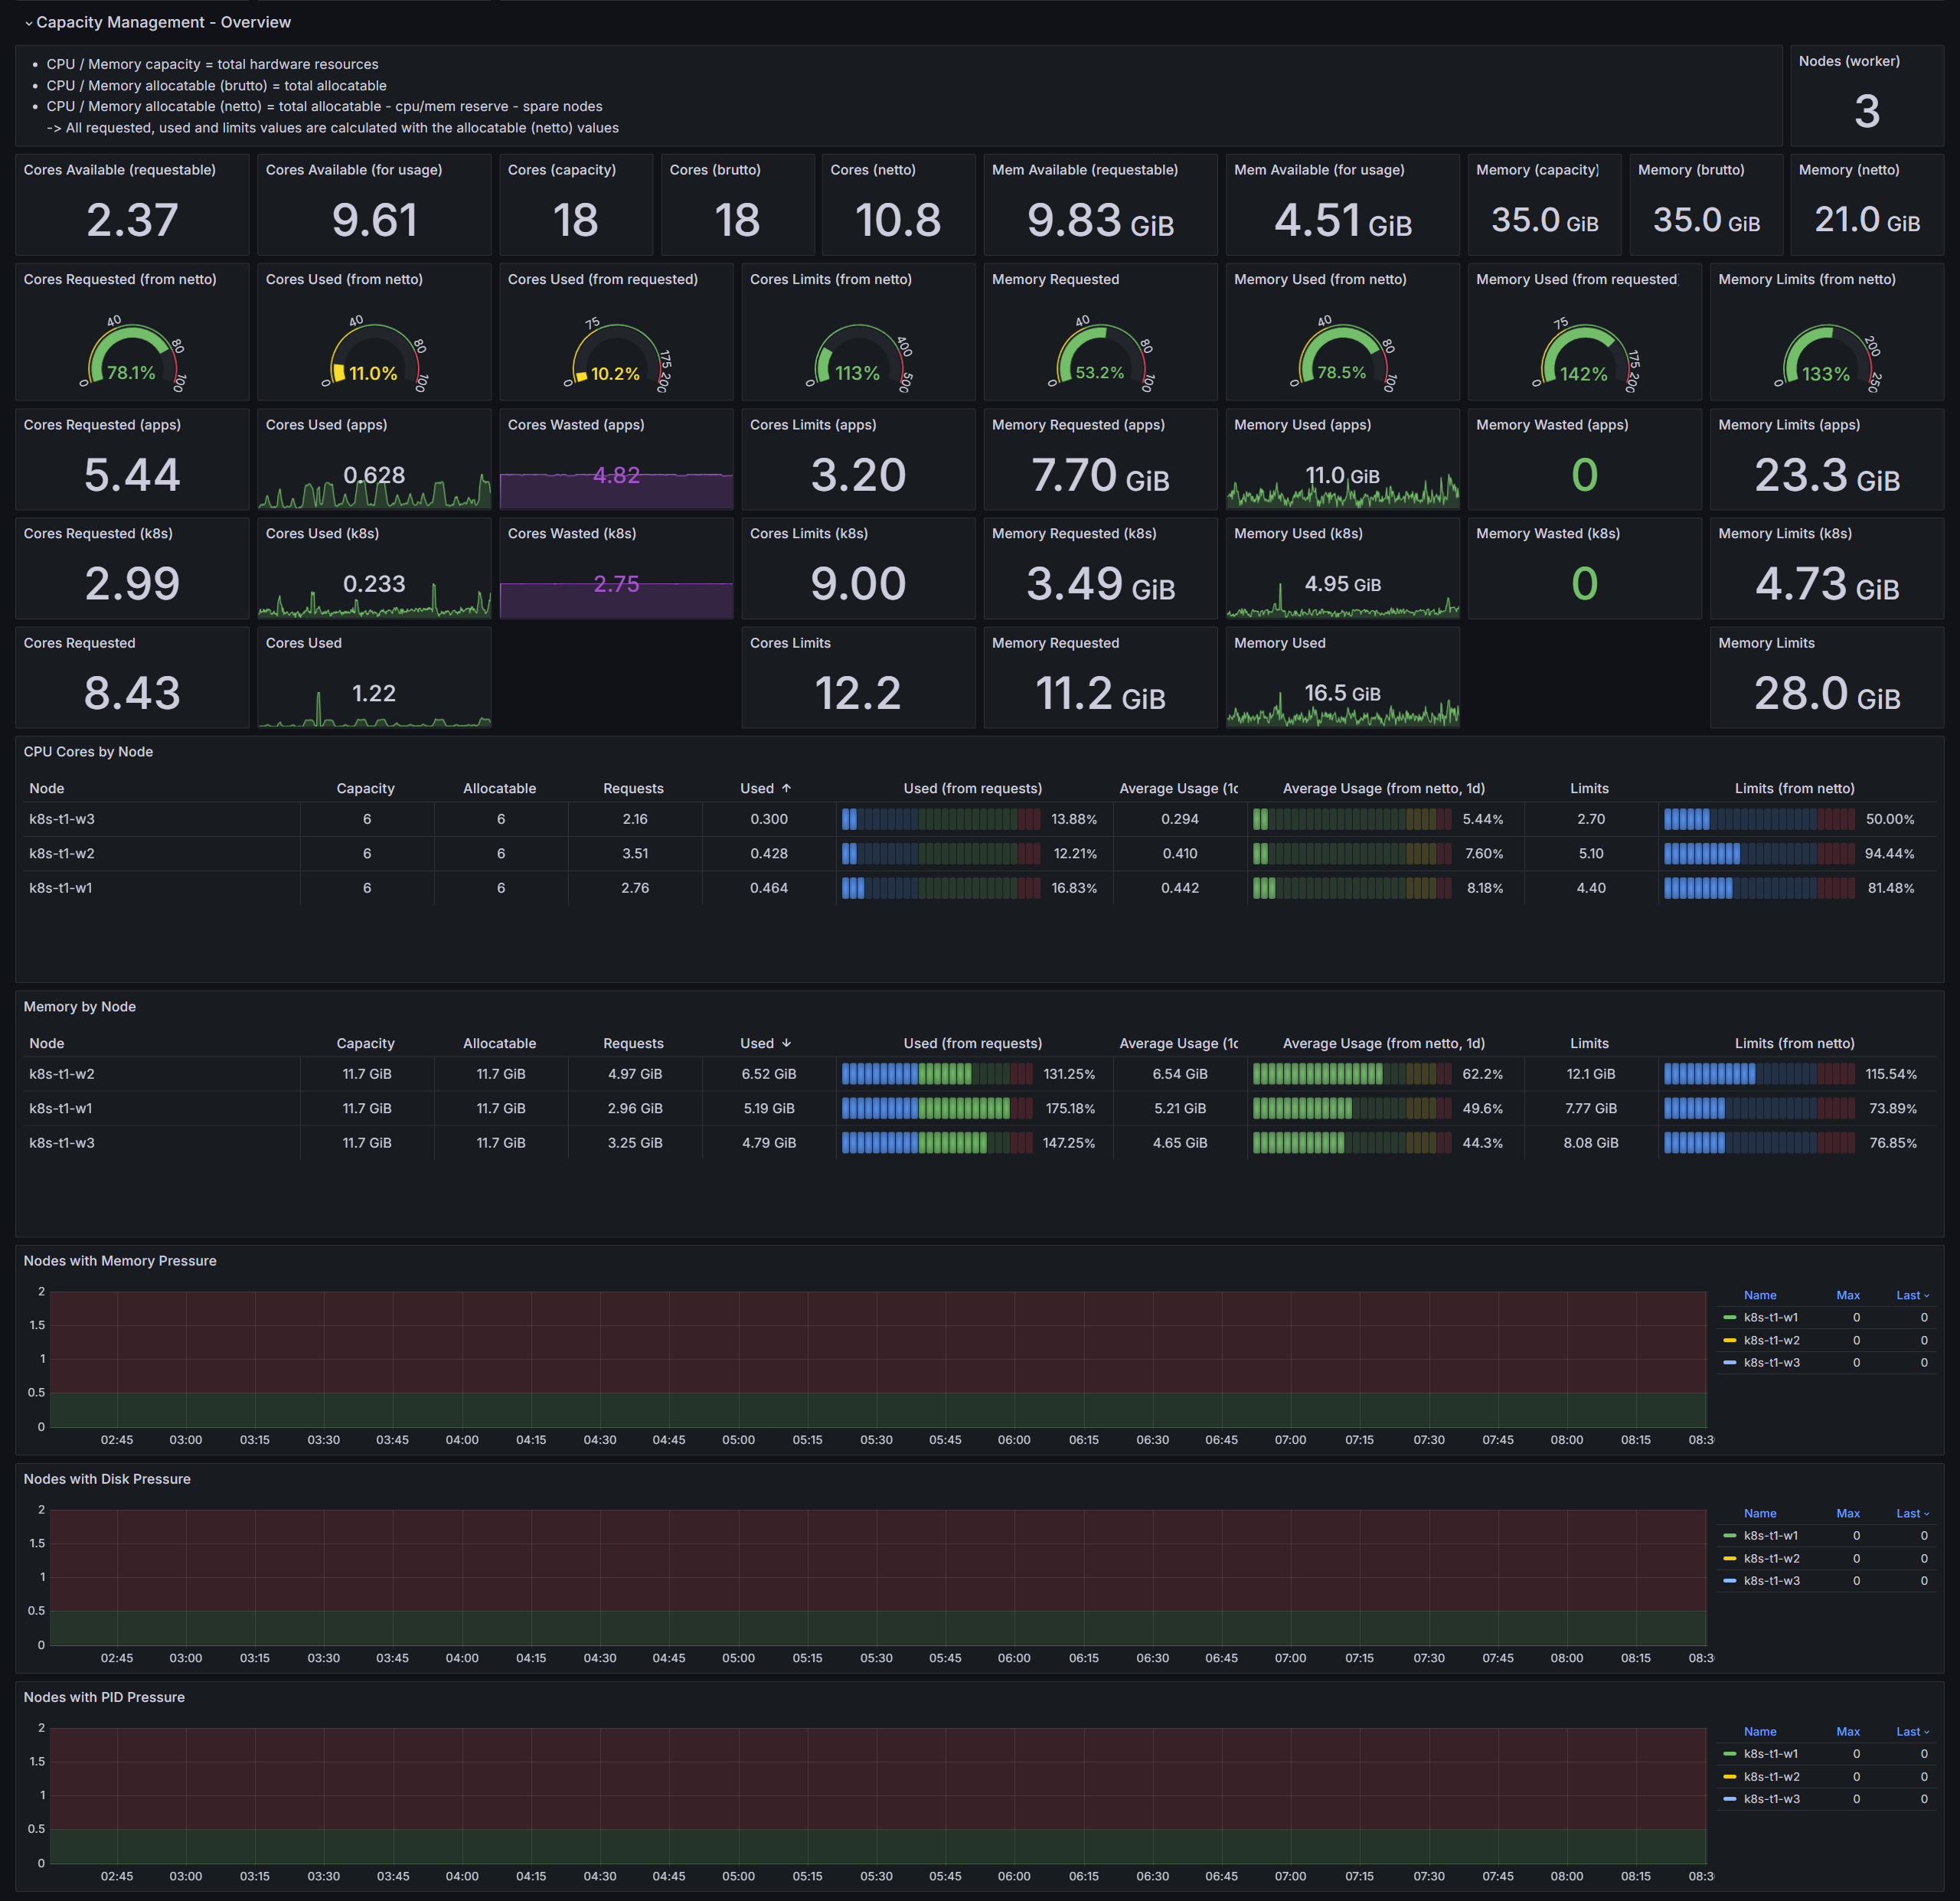
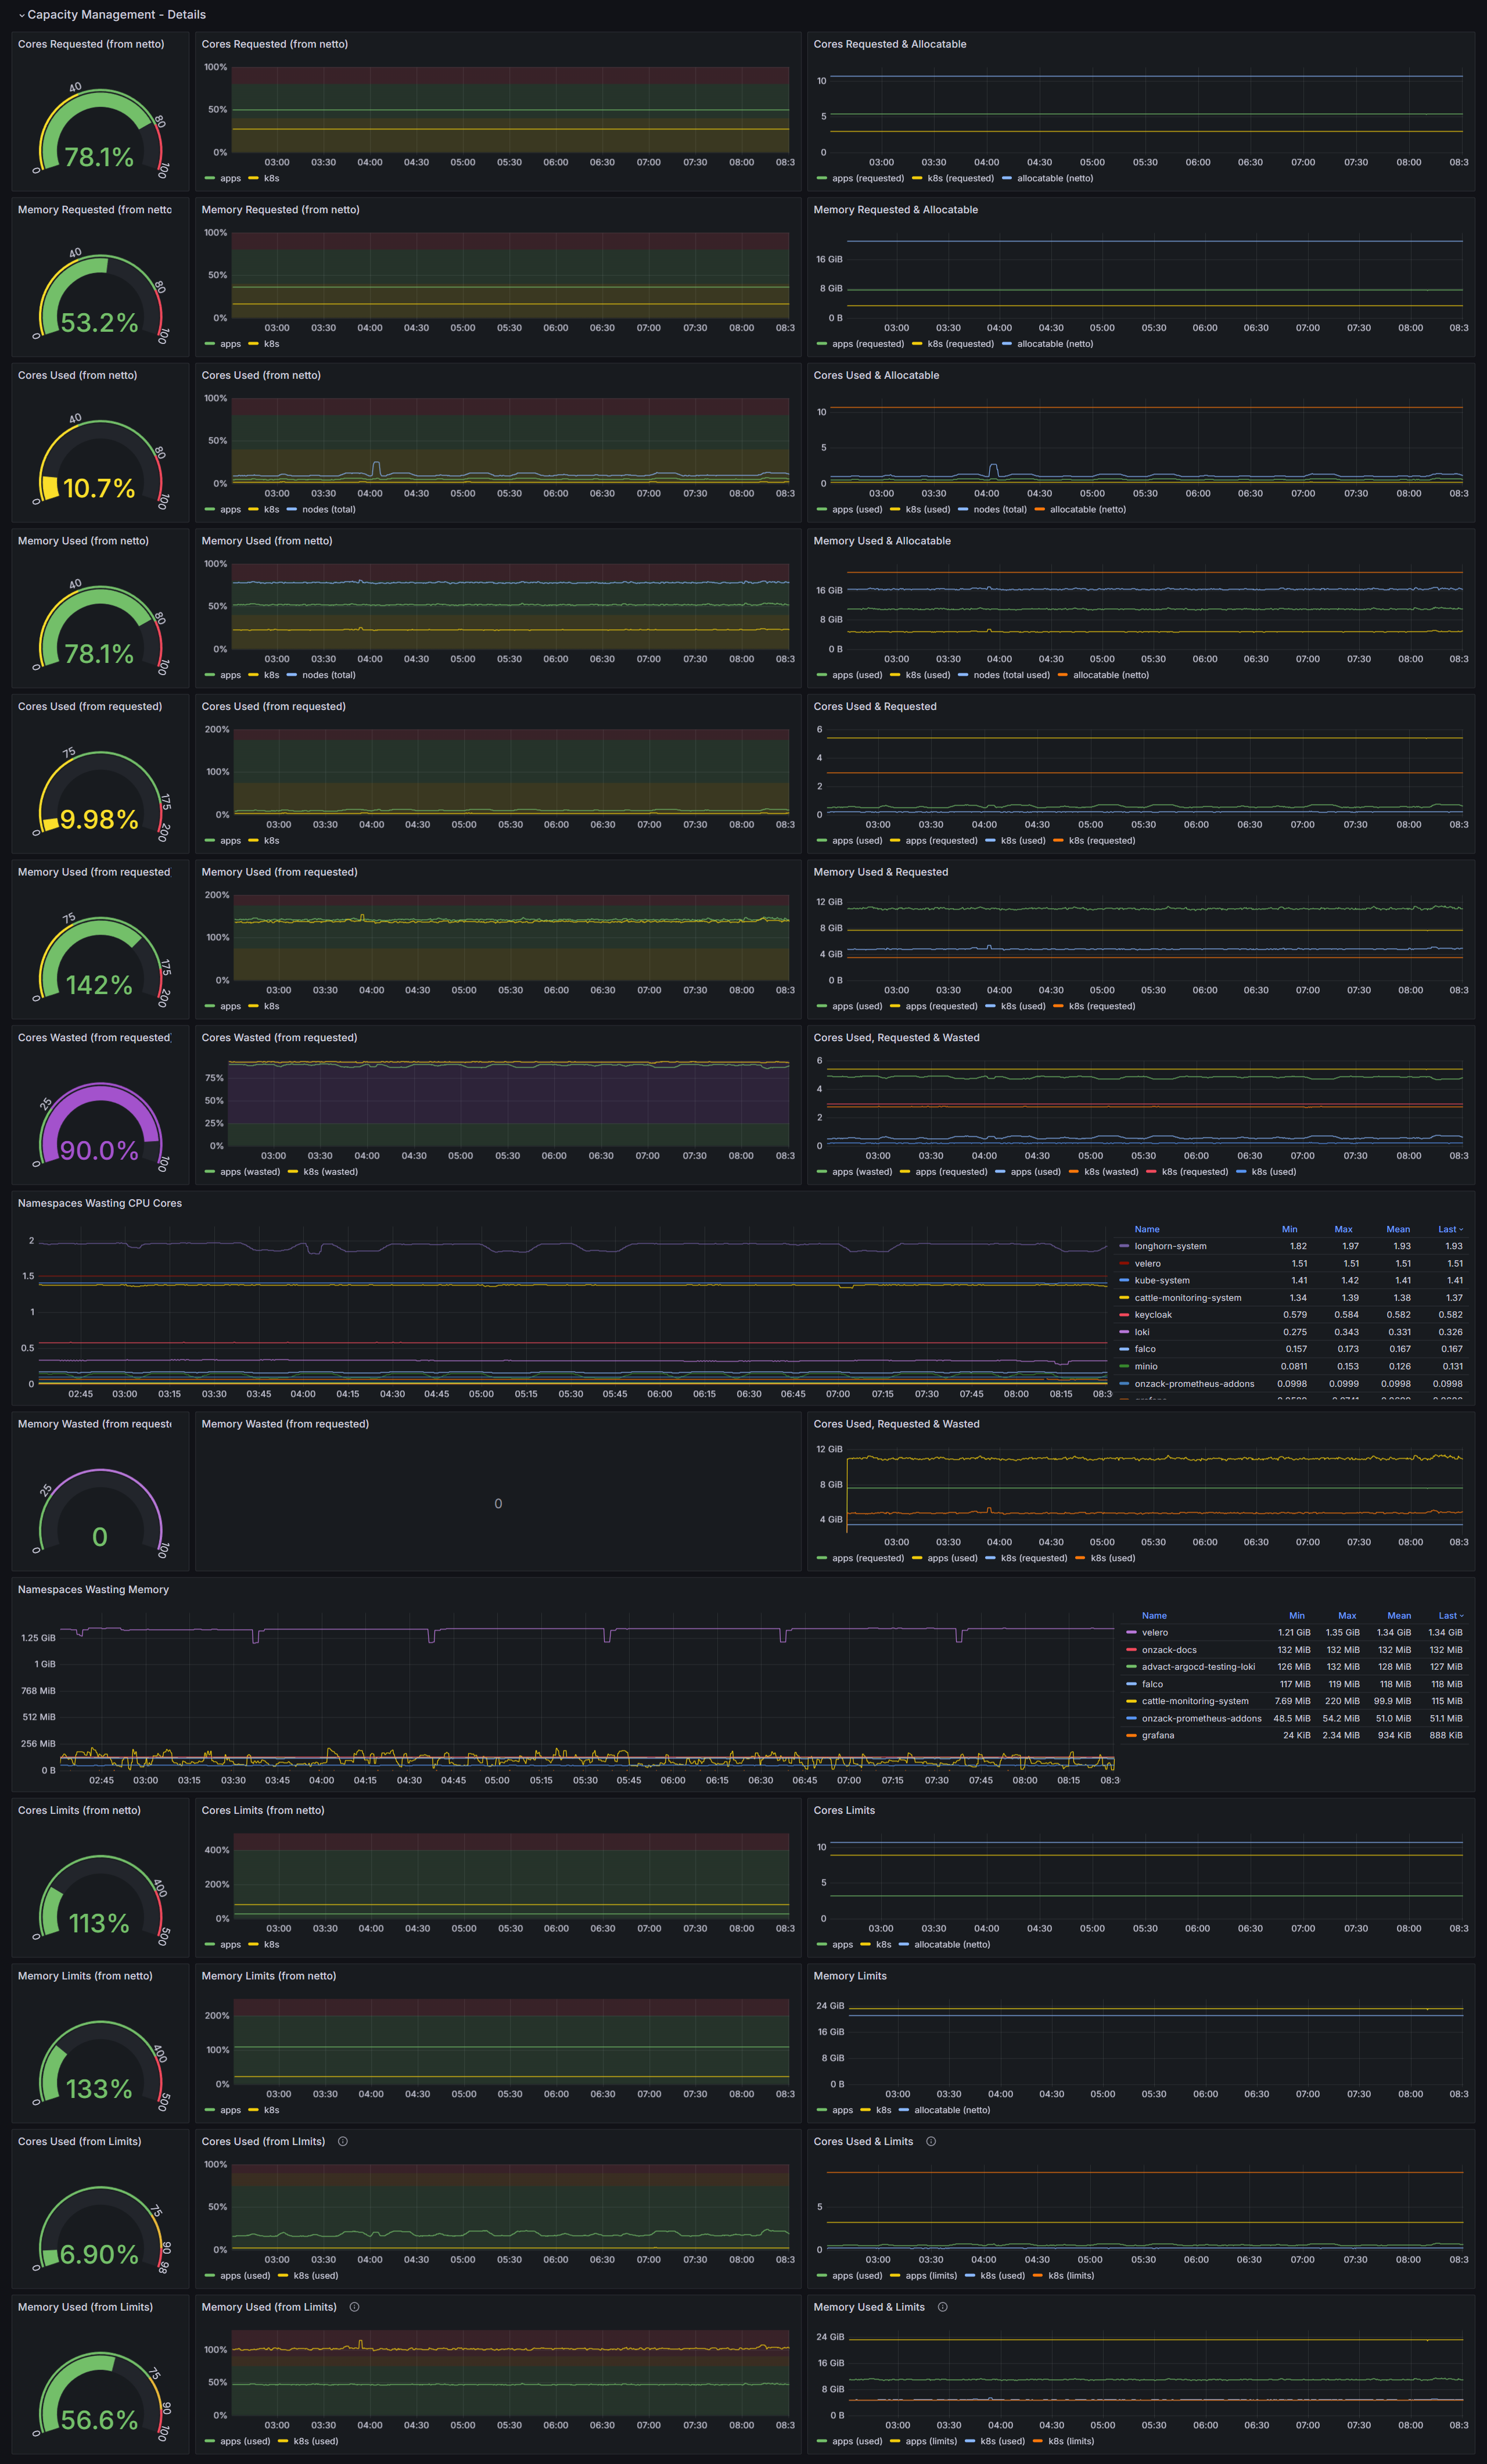
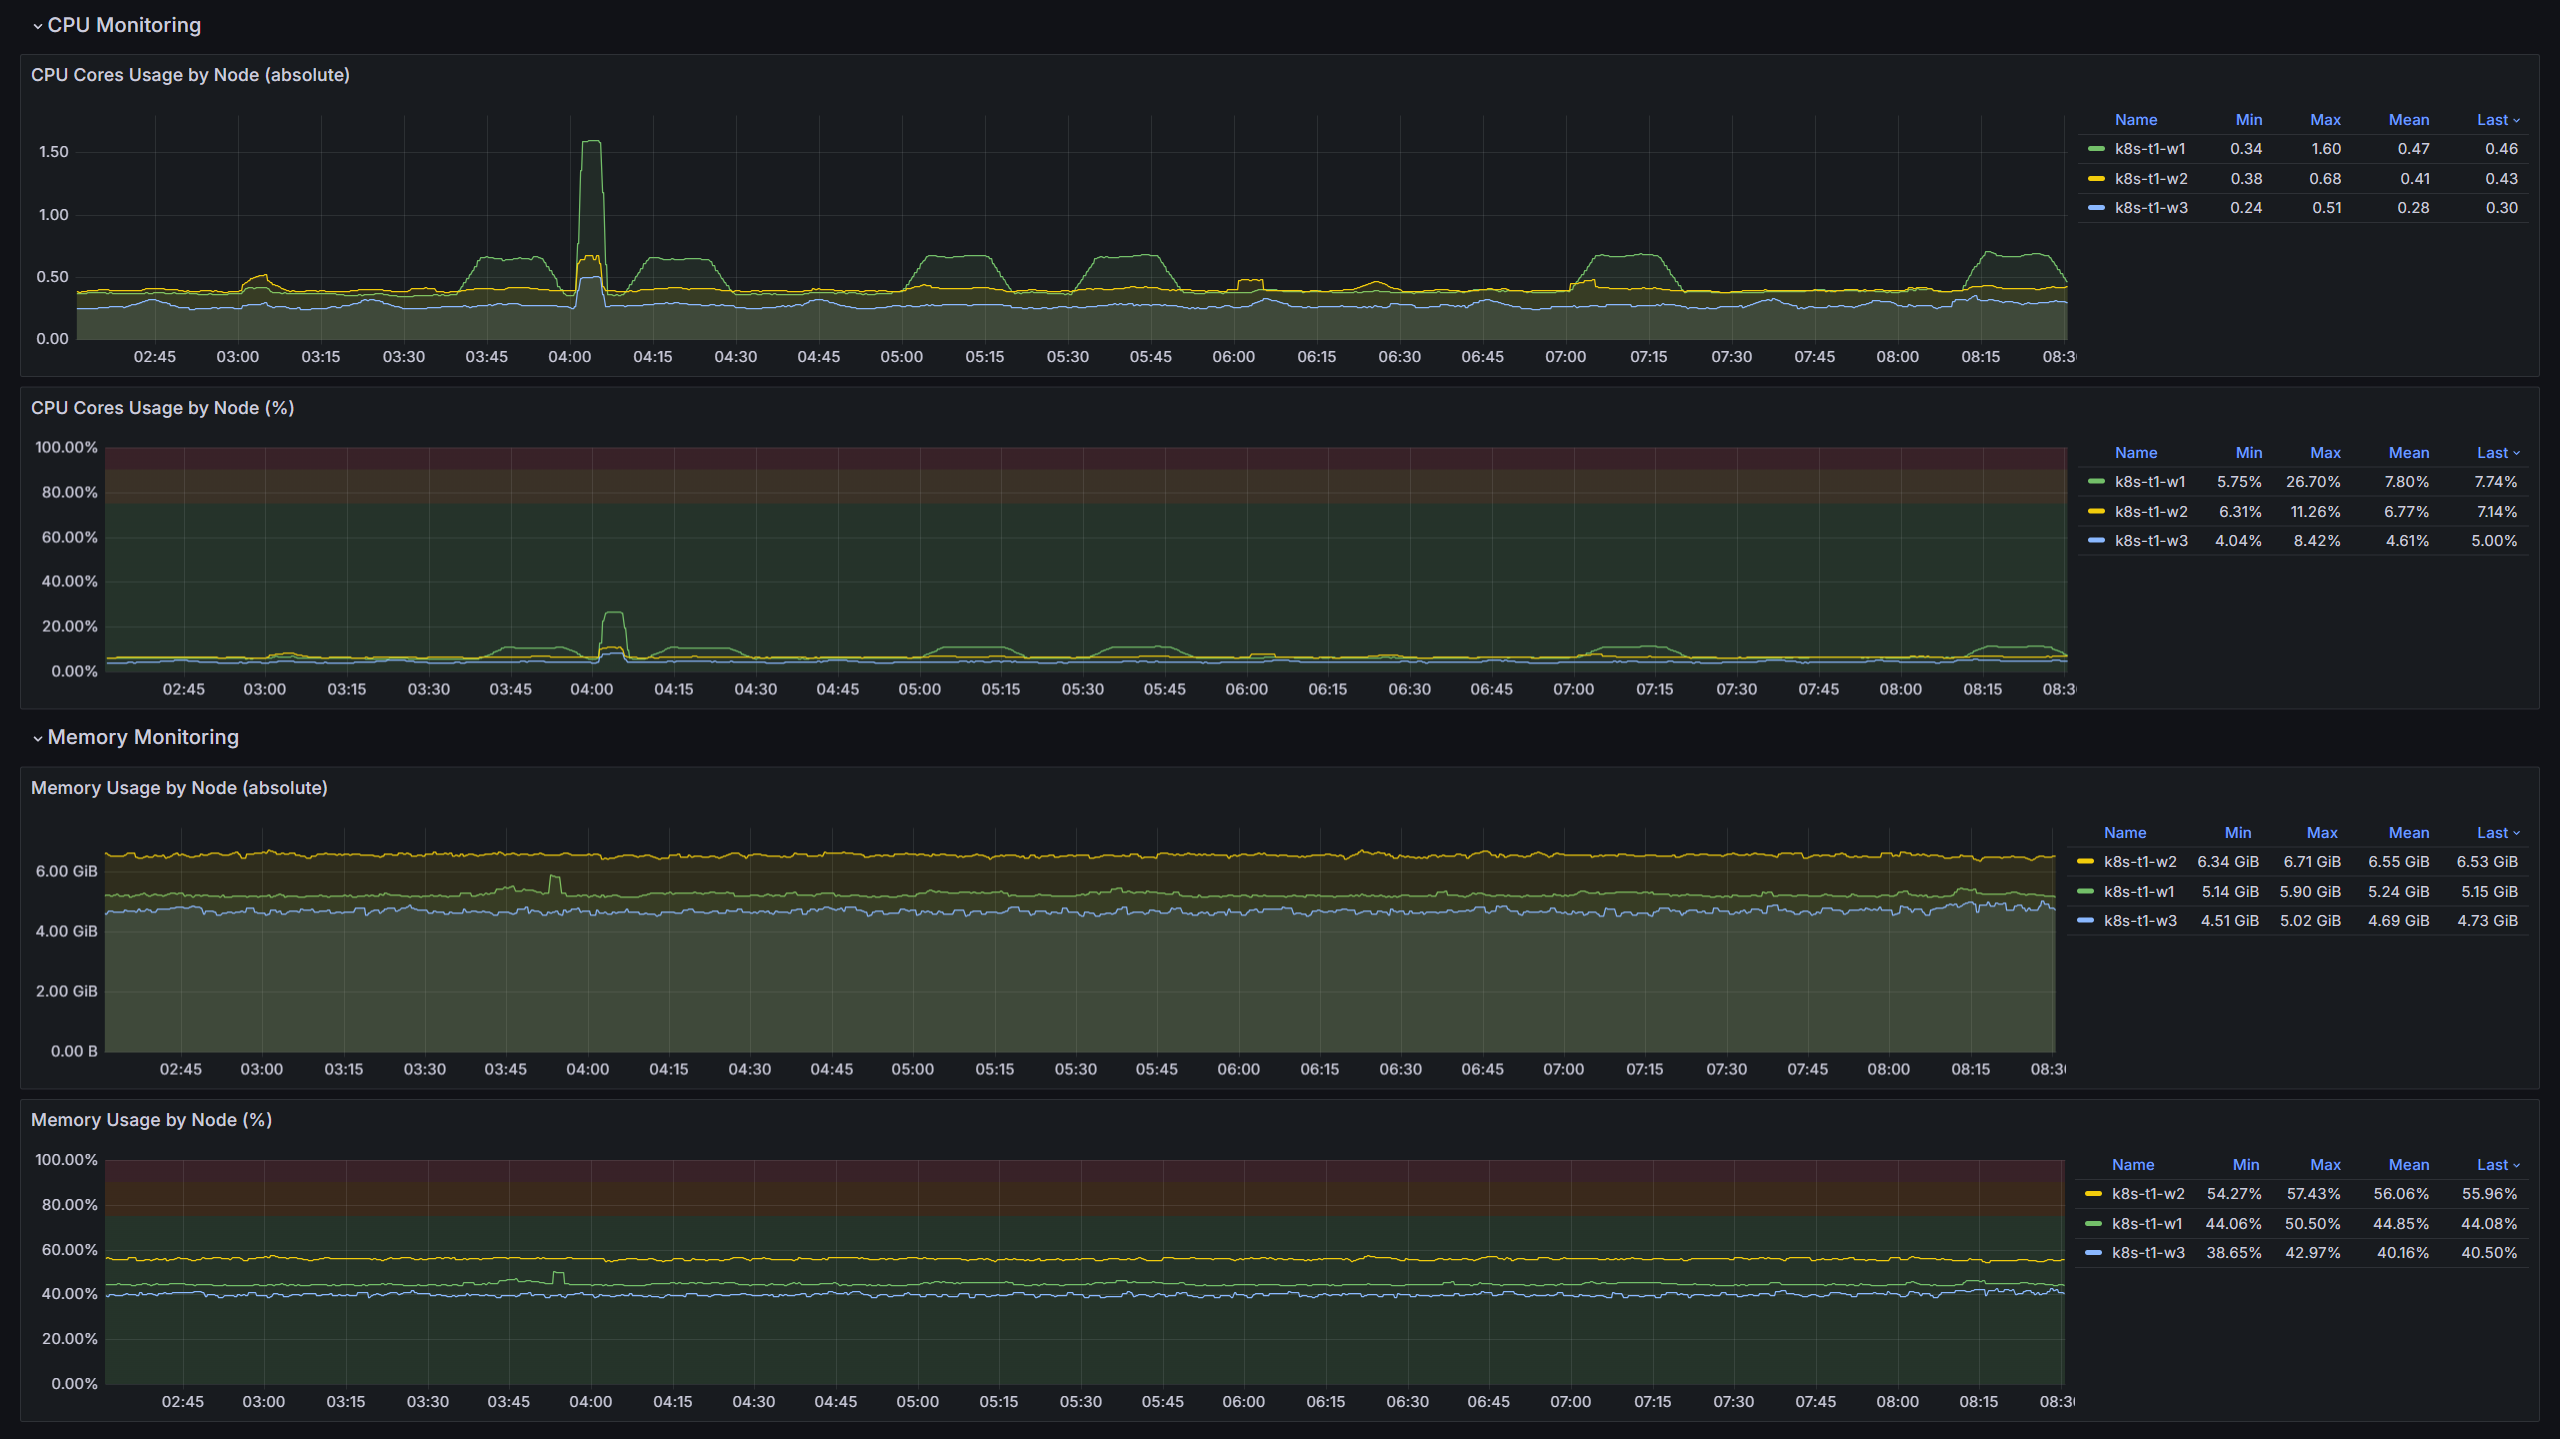
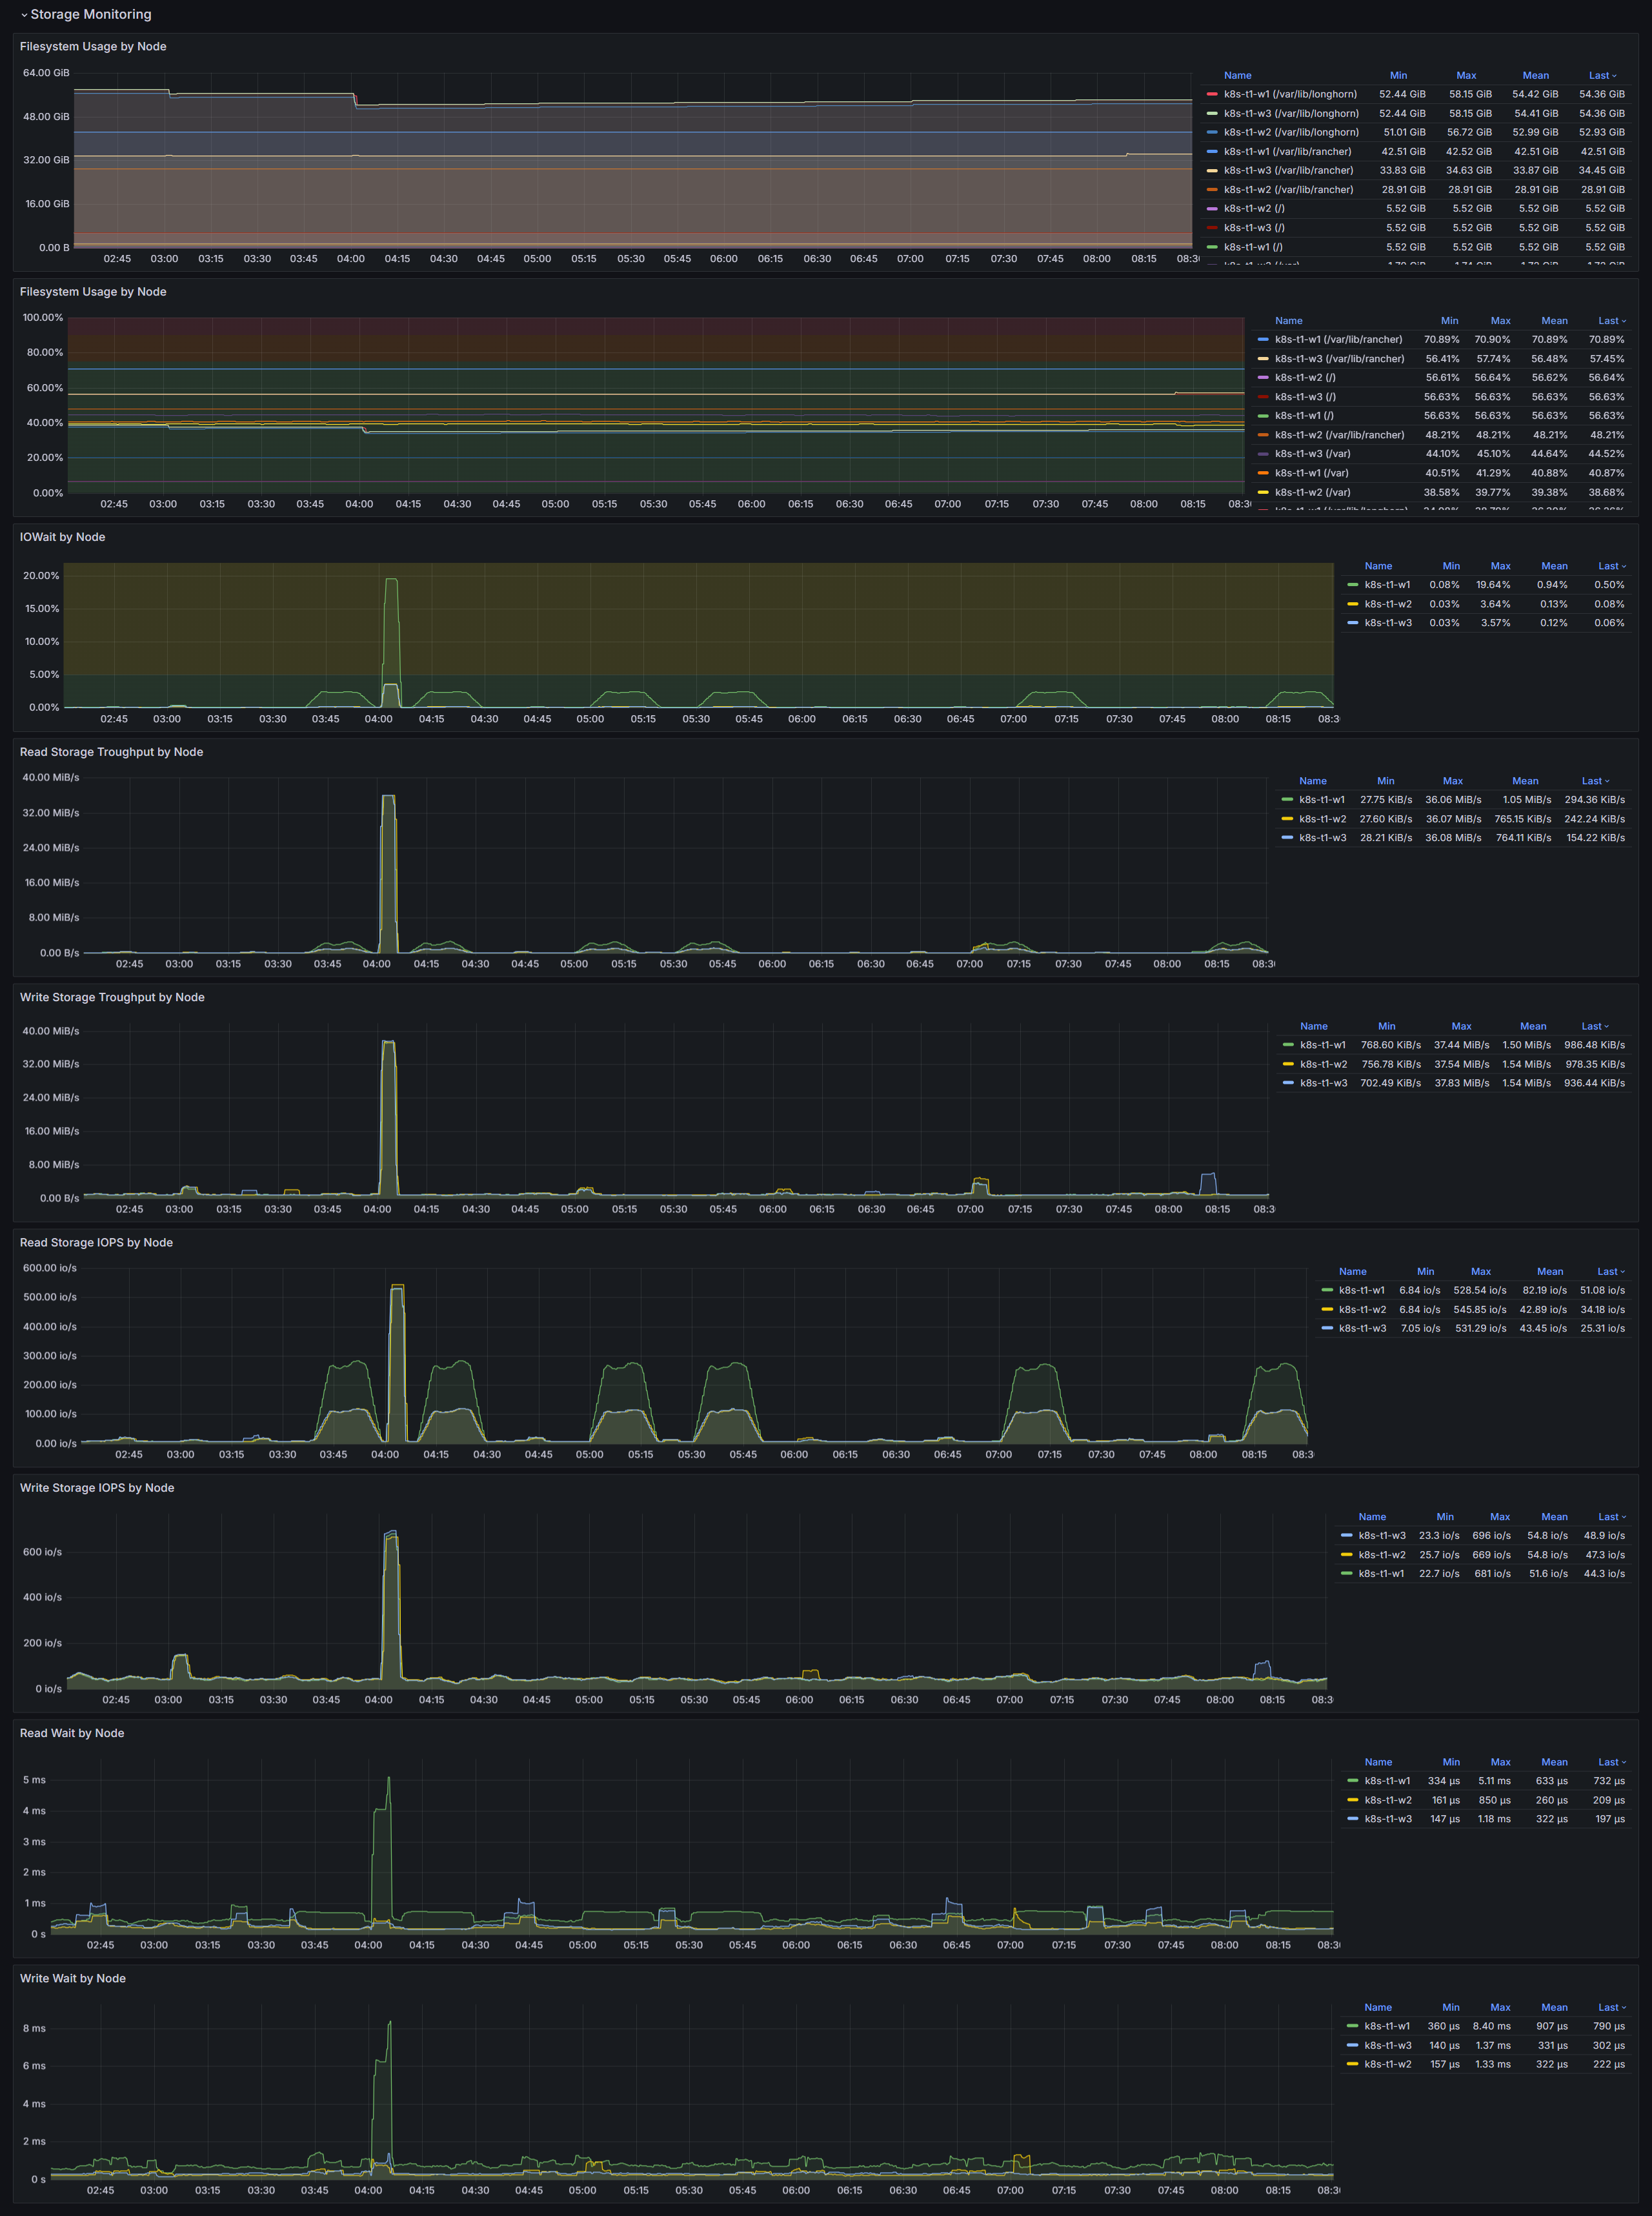
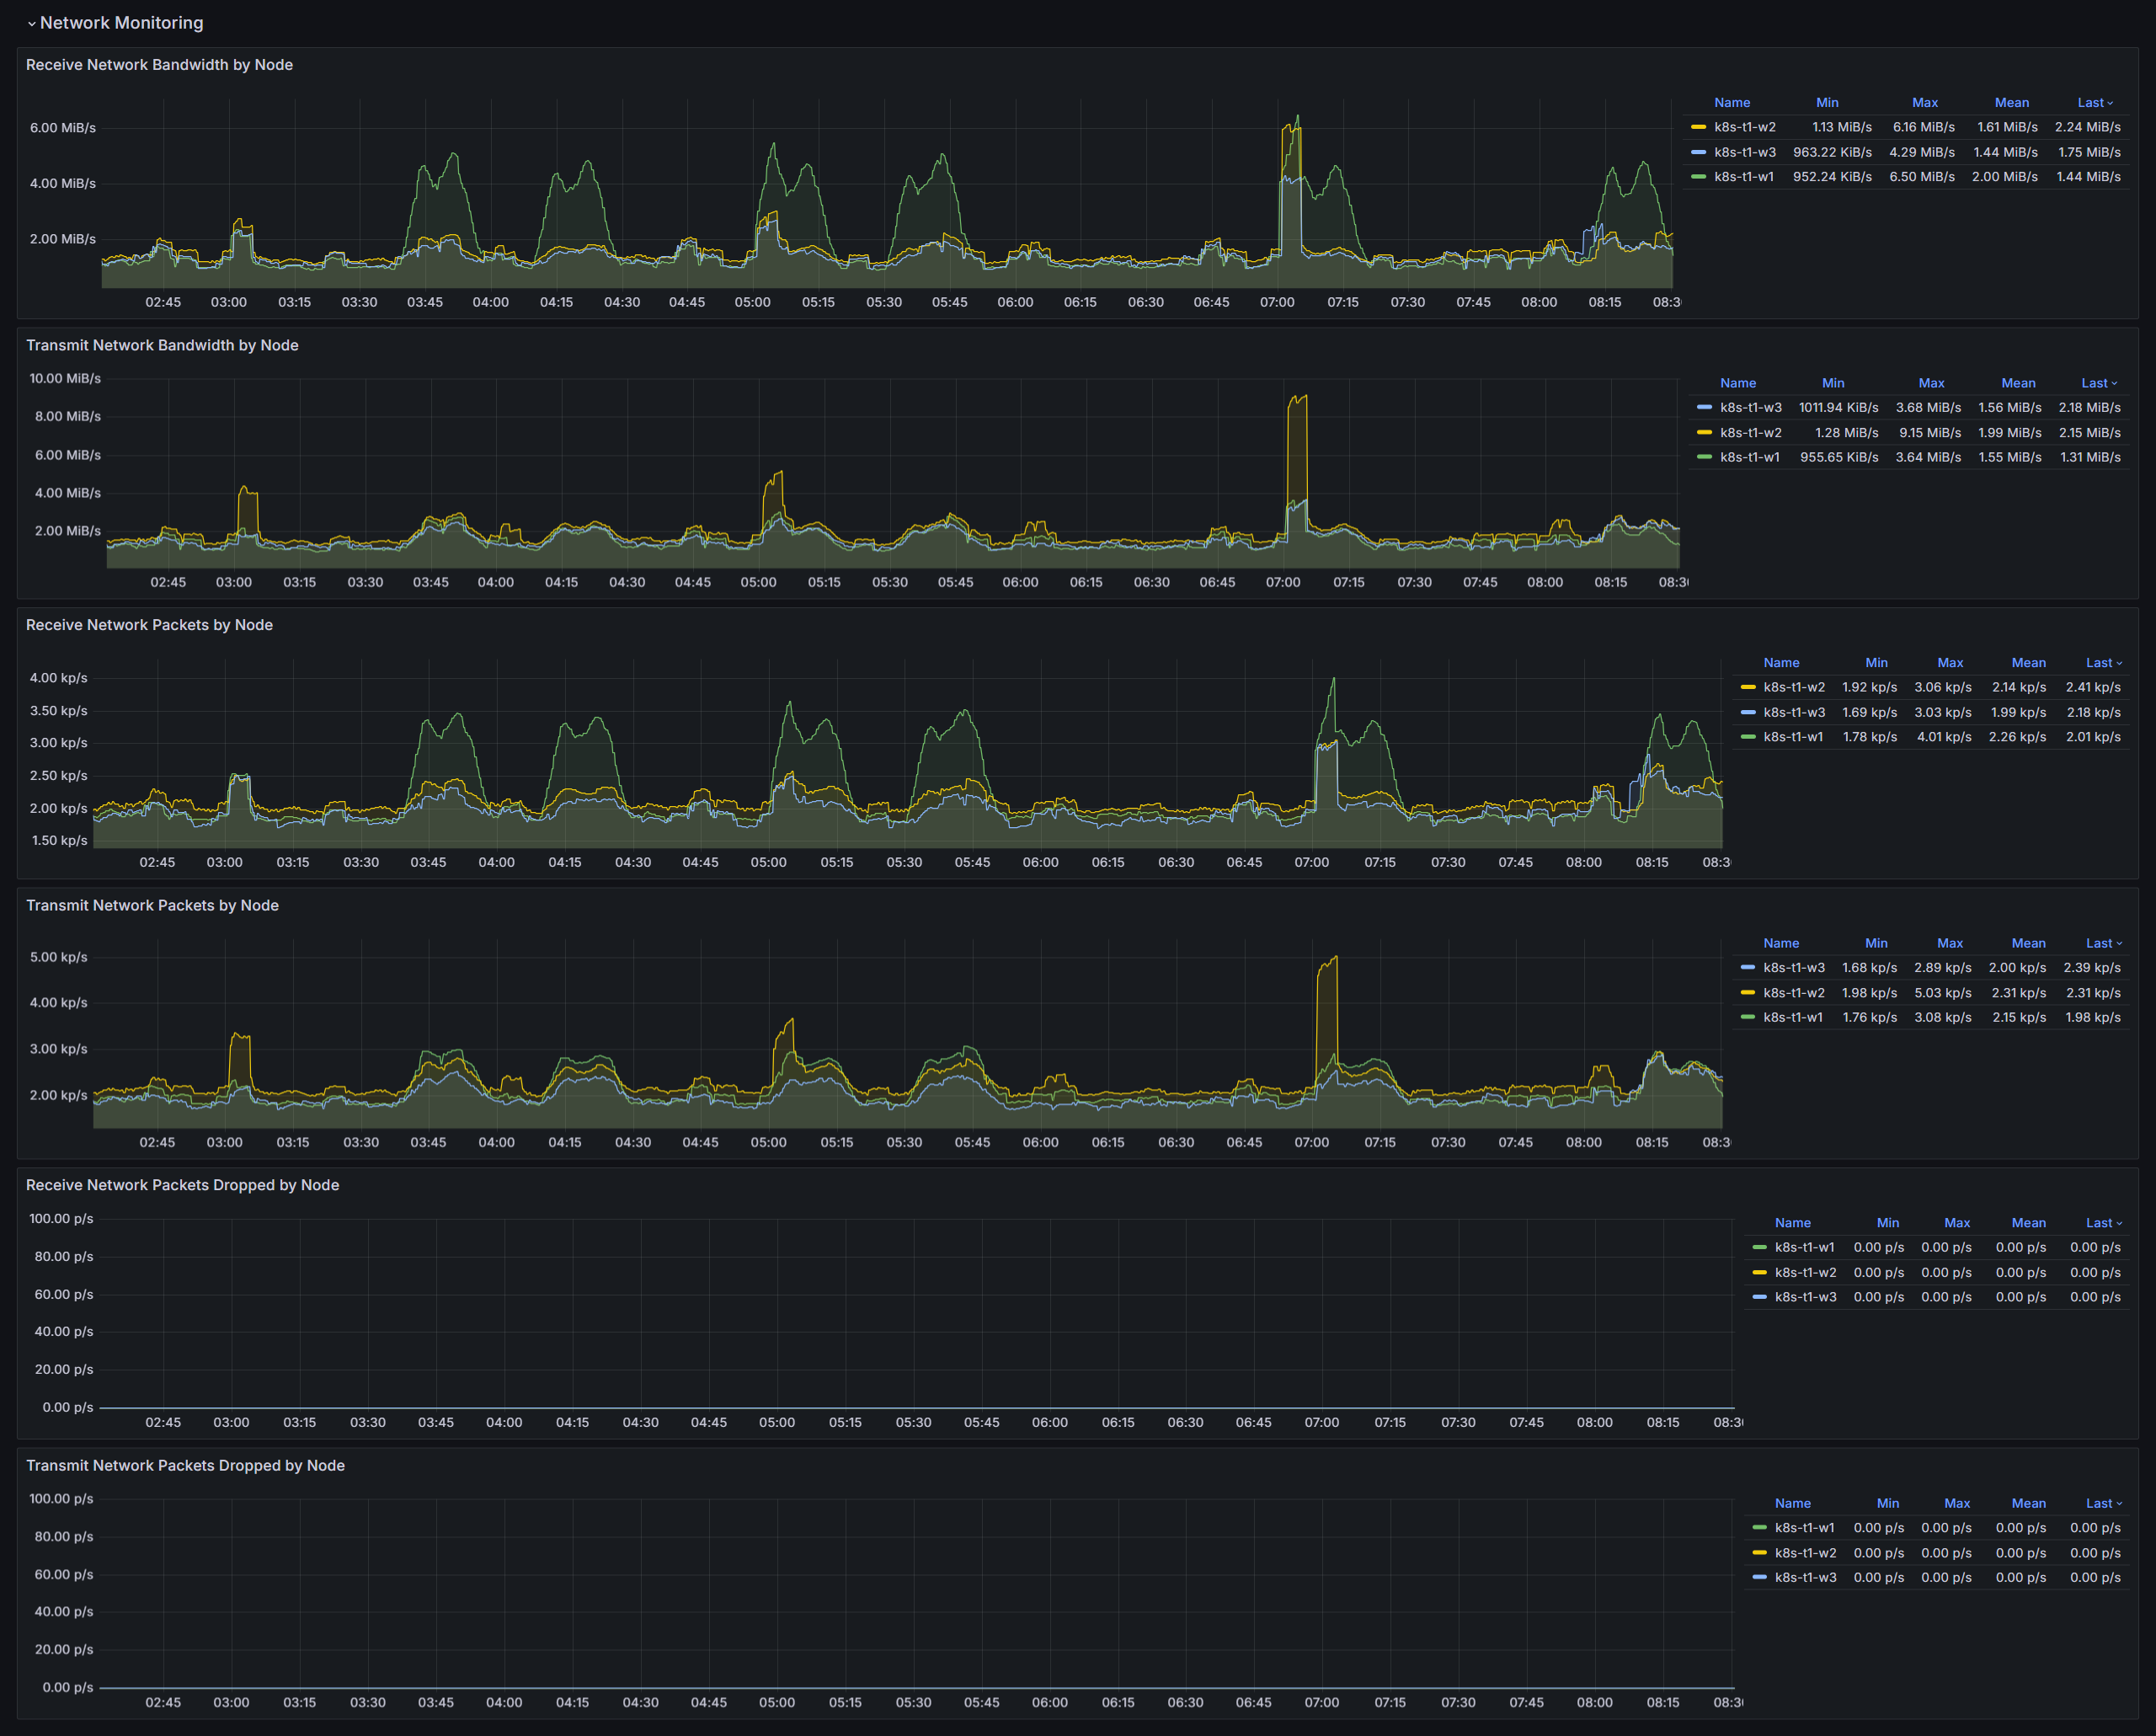
ONZACK Grafana Dashboard for Kubernetes, OpenShift and other Kubernetes distributions.
ONZACK worked with LGT Bank in Liechtenstein to create Grafana dashboards for Kubernetes and OpenShift. LGT Bank and ONZACK have agreed to make the dashboards available to the Kubernetes and OpenShift community so that everyone can benefit from the dashboards. ONZACK will continue to maintain and develop the dashboards in the future.
Prerequisites / Recording Rules
You can also find our Dashboards on GitHub.
Data source config
Collector type:
Collector plugins:
Collector config:
Revisions
Upload an updated version of an exported dashboard.json file from Grafana
| Revision | Description | Created | |
|---|---|---|---|
| Download |