ZFS Pool Metrics (InfluxDBv2)
Dashboard of metrics generated by Richard Elling's cool "zpool_influxdb" utility (included in OpenZFS), version for InfluxDB v2.
A dashboard of metrics produced by the zpool_influxdb utility (see the manpage & GitHub page for more info).
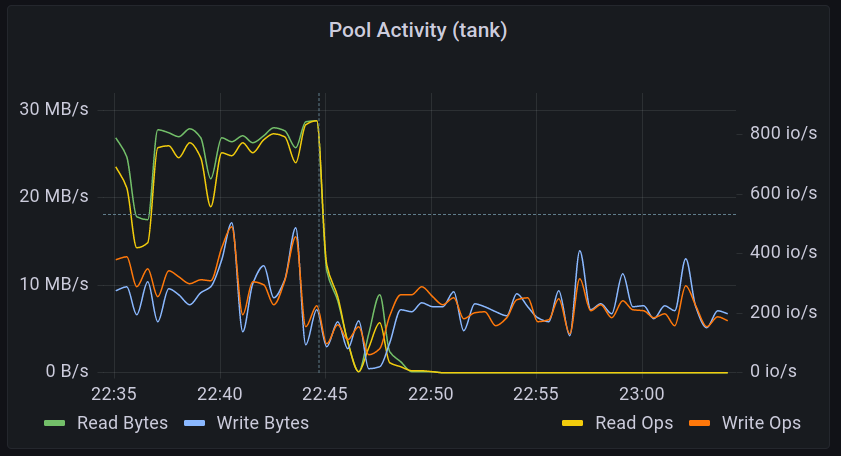
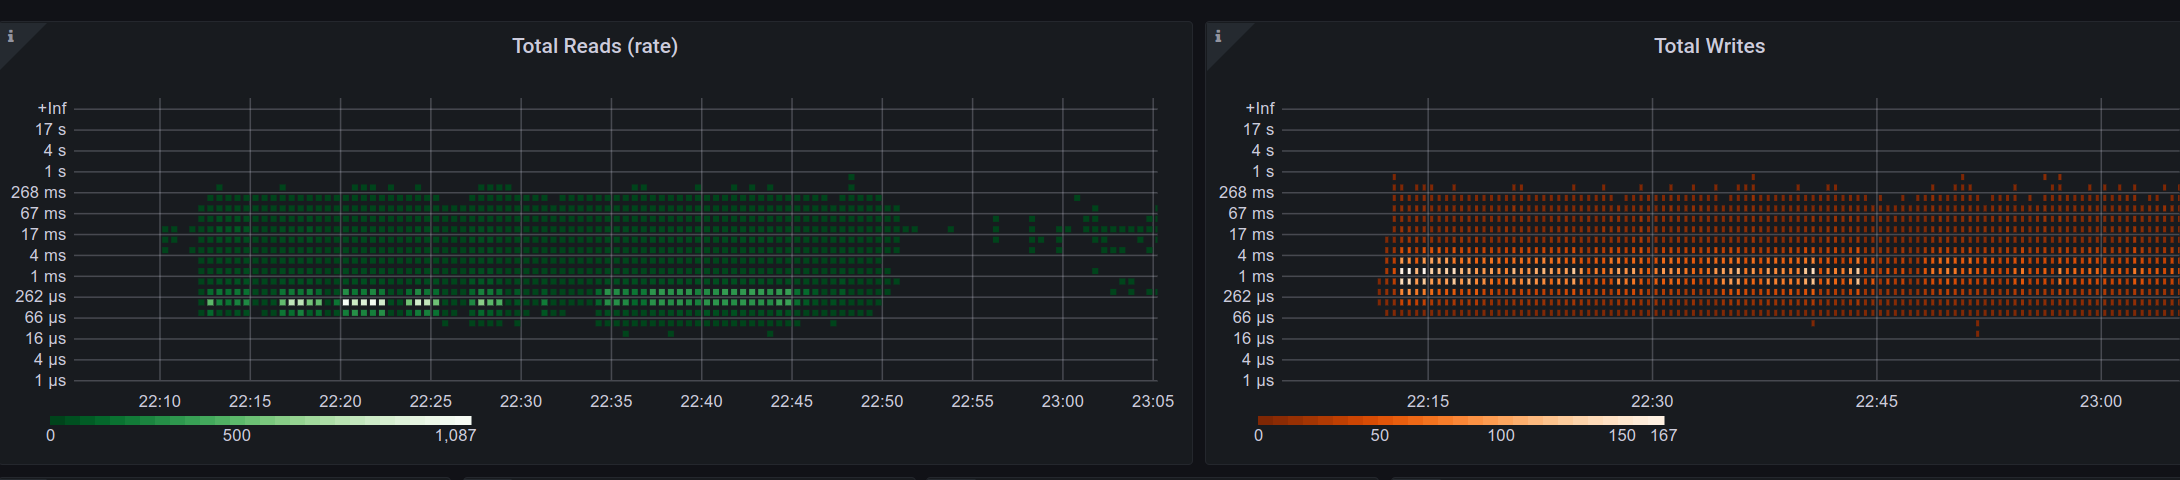
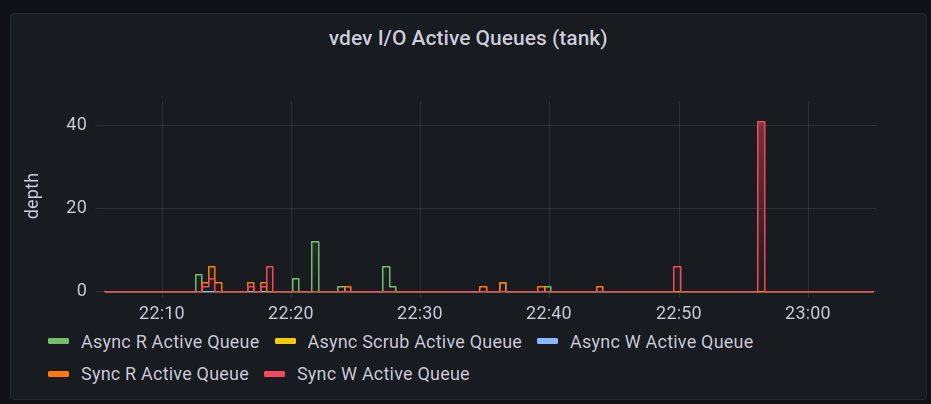
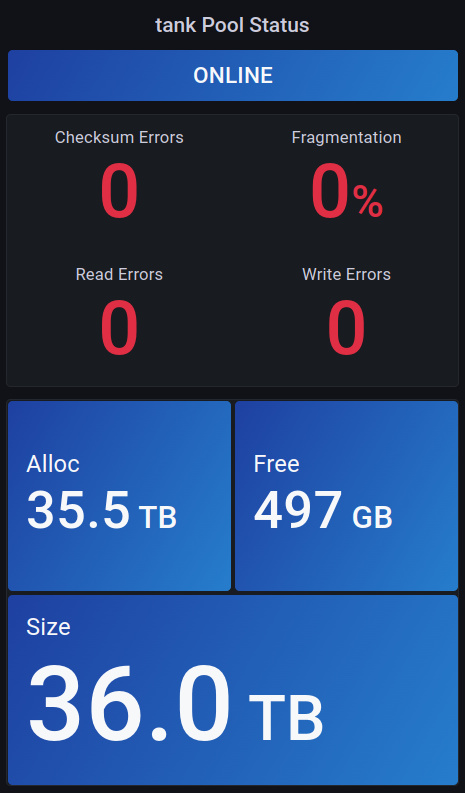
Features include pool activity, status, queues, and individual/aggregate IO sizes.
It is a port of Scott MacDonald's influxQL / v1 dashboard. This updated dashboard supports InfluxDBv2 and is written in flux.
Questions, comments, issues? Please use the GitHub repo for this dashboard. Feedback is welcomed!
Data source config
Collector type:
Collector plugins:
Collector config:
Revisions
Upload an updated version of an exported dashboard.json file from Grafana
| Revision | Description | Created | |
|---|---|---|---|
| Download |