Traefik Official Kubernetes Dashboard
Official dashboard for Traefik on Kubernetes
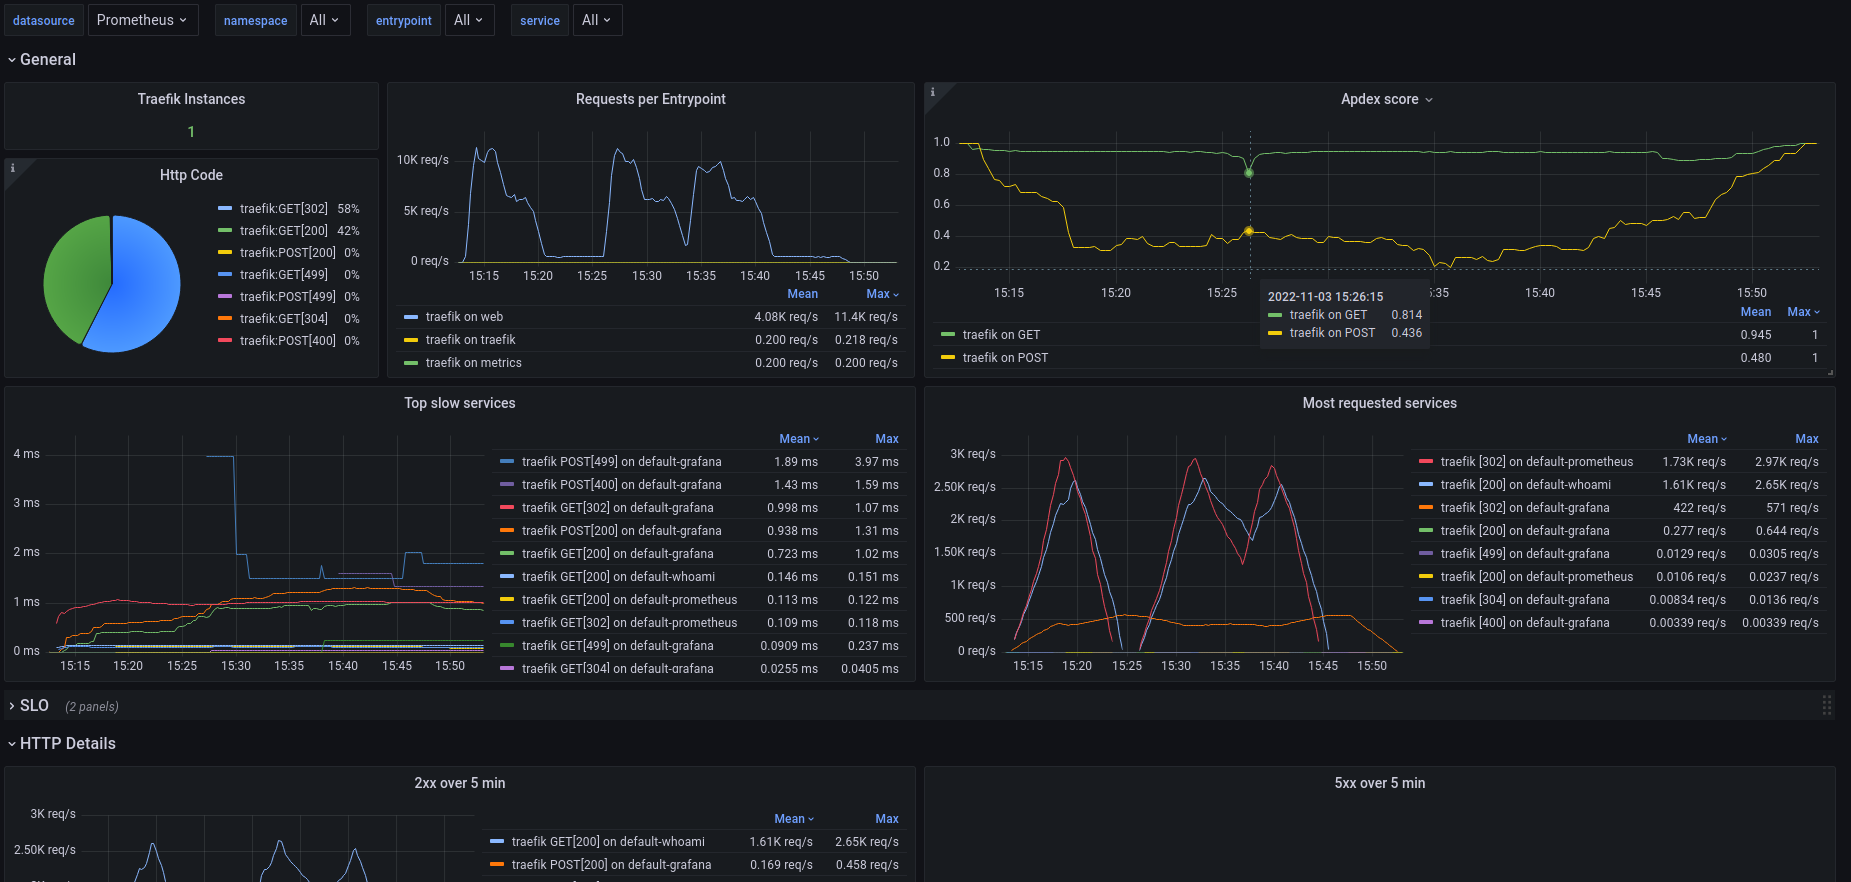
Official dashboard for Traefik on Kubernetes. It uses native prometheus metrics from Traefik and namespace label. It can be filtered by DataSources, Services and Entrypoint.
https://github.com/traefik/traefik/tree/master/contrib/grafana
Data source config
Collector type:
Collector plugins:
Collector config:
Revisions
Upload an updated version of an exported dashboard.json file from Grafana
| Revision | Description | Created | |
|---|---|---|---|
| Download |
Kubernetes
Monitor your Kubernetes deployment with prebuilt visualizations that allow you to drill down from a high-level cluster overview to pod-specific details in minutes.
Learn more