Traefik Official Standalone Dashboard
Official dashboard for Standalone Traefik
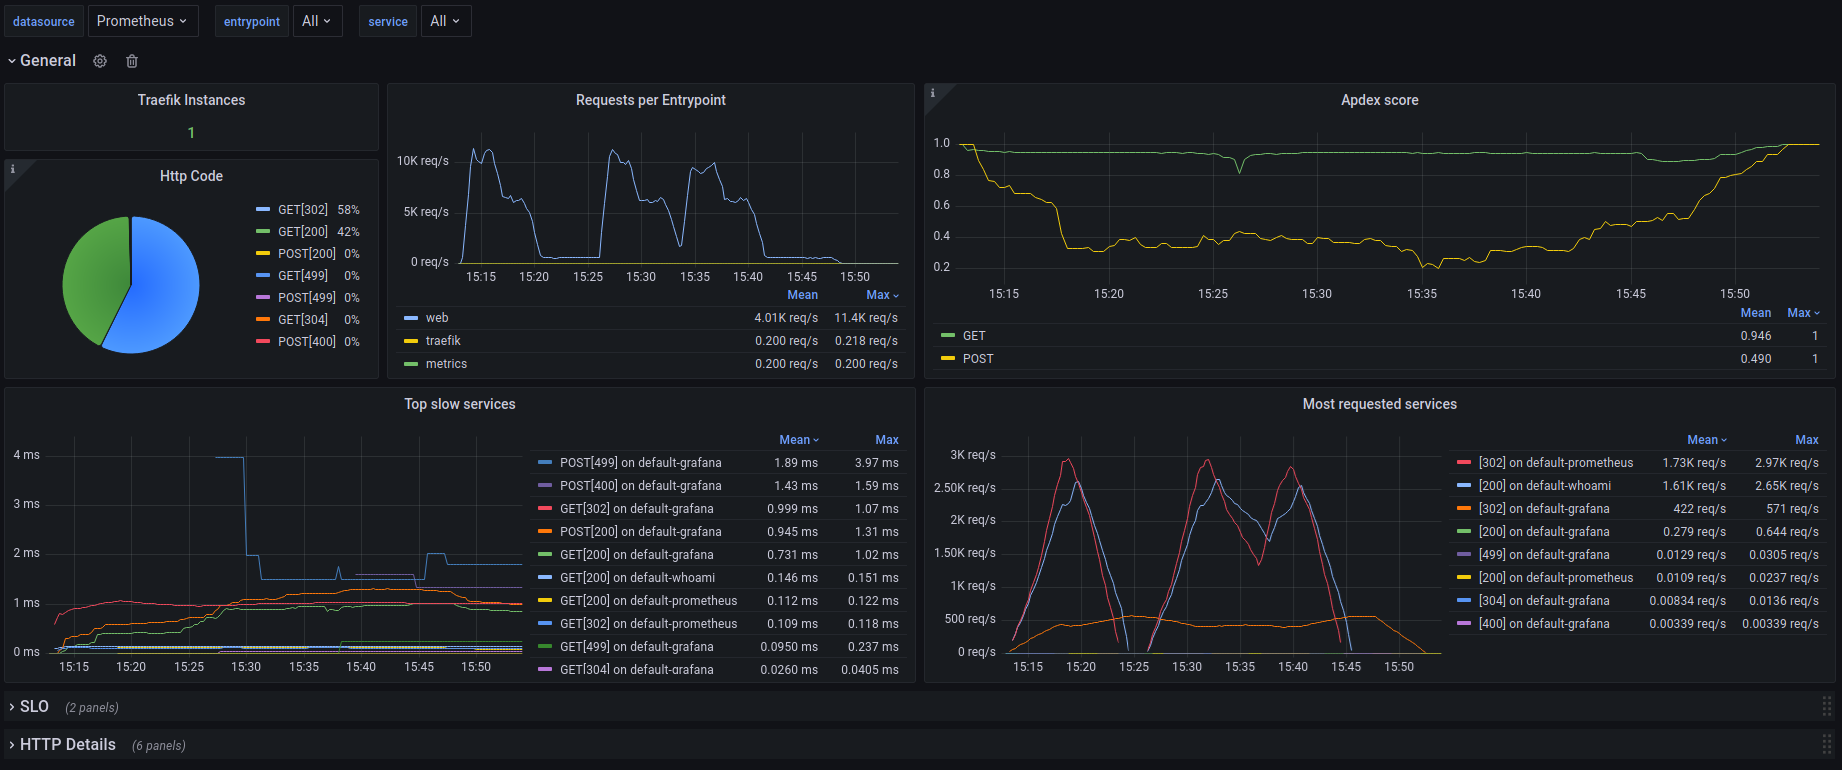
Official dashboard for a single instance of Traefik. It only uses native prometheus metrics from Traefik. It can be filtered by DataSources, Services and Entrypoint.
https://github.com/traefik/traefik/tree/master/contrib/grafana
Data source config
Collector type:
Collector plugins:
Collector config:
Revisions
Upload an updated version of an exported dashboard.json file from Grafana
| Revision | Description | Created | |
|---|---|---|---|
| Download |
Traefik
Easily monitor Traefik, the dynamic load balancer, with Grafana Cloud's out-of-the-box monitoring solution.
Learn more