
Smokeping blackbox_exporter
Smokeping-like latency and loss graphs from blackbox_exporter and prometheus
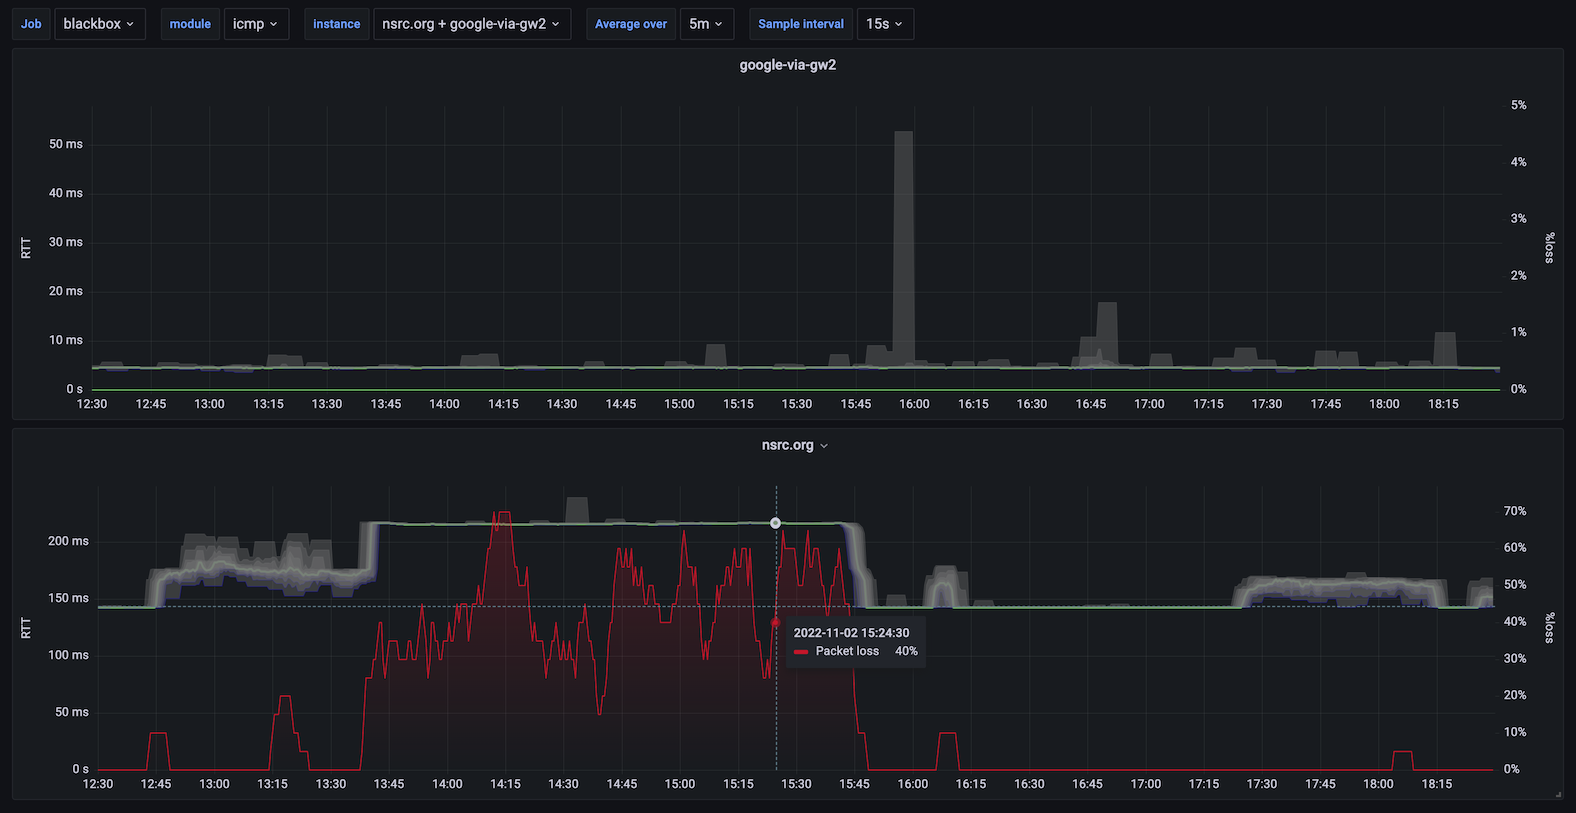
This dashboard generates Smokeping-like visualizations from blackbox_exporter measurements stored in prometheus. With a scrape interval of 15 seconds you get 20 packets every 5 minutes, which is an equivalent resolution to Smokeping, but lower intervals can be used for higher sensitivity.
The "smoke" shows the range of minimum RTT, 10th percentile, 20th percentile ... 90th percentile, and maximum. The median is shown with a strong green line. Packet loss is overlaid.
For ICMP probes: probe_icmp_duration_seconds{phase="rtt"} is used, giving the ping time without DNS lookup or other overheads.
For other probes (HTTP or DNS): probe_duration_seconds is used, giving the complete request/response cycle time.
Data source config
Collector config:
Upload an updated version of an exported dashboard.json file from Grafana
| Revision | Description | Created | |
|---|---|---|---|
| Download |