RabbitMQ / Queue
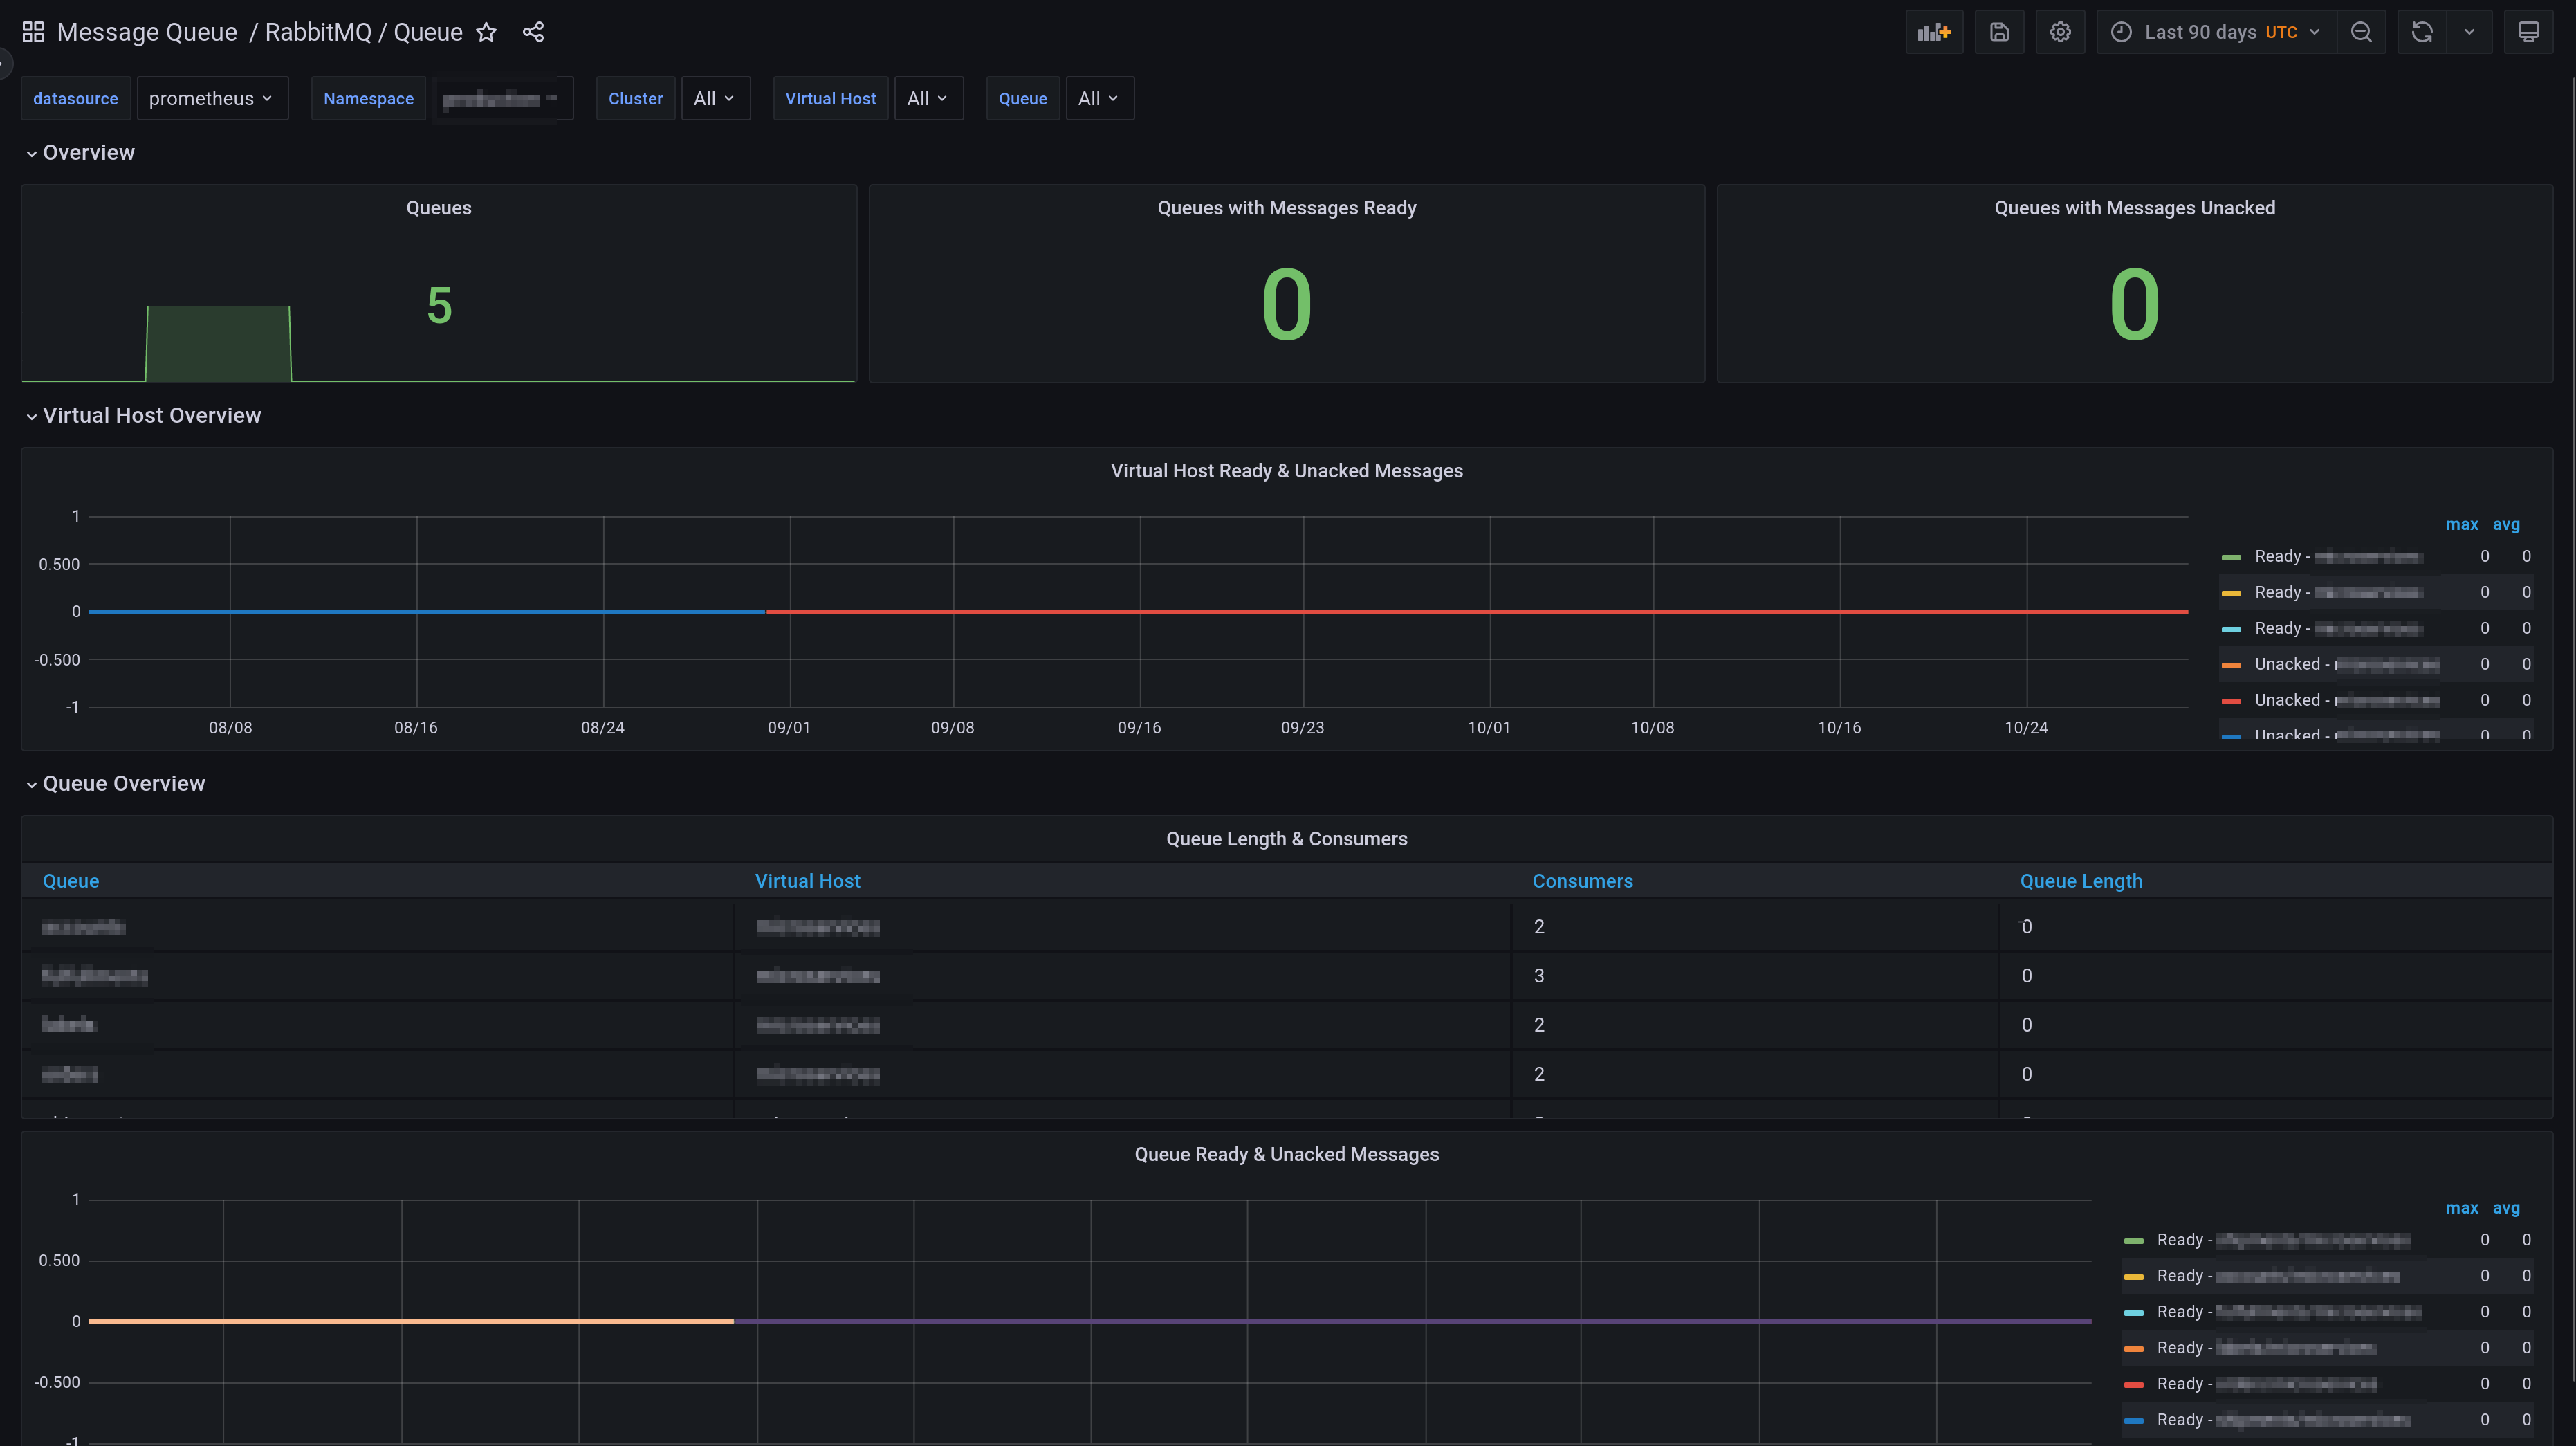
A dashboard that monitors RabbitMQ. It is created using the (rabbitmq-mixin)[https://github.com/adinhodovic/rabbitmq-mixin].
A dashboard that monitors RabbitMQ. It is created using the (rabbitmq-mixin)[https://github.com/adinhodovic/rabbitmq-mixin].
Focuses on per-queue visualization based on detailed metrics. Combines well with the official dashboard for RabbitMQ.
I've written a blog post on RabbiqMQ per-queue monitoring.
Data source config
Collector type:
Collector plugins:
Collector config:
Revisions
Upload an updated version of an exported dashboard.json file from Grafana
| Revision | Description | Created | |
|---|---|---|---|
| Download |
RabbitMQ
Easily monitor RabbitMQ, the most widely deployed open source message broker, with Grafana Cloud's out-of-the-box monitoring solution.
Learn more