AWS ENA Network Performance
A dashbaord for monitoring AWS Elastic Network Adapter performance using the Prometheus Node exporter.
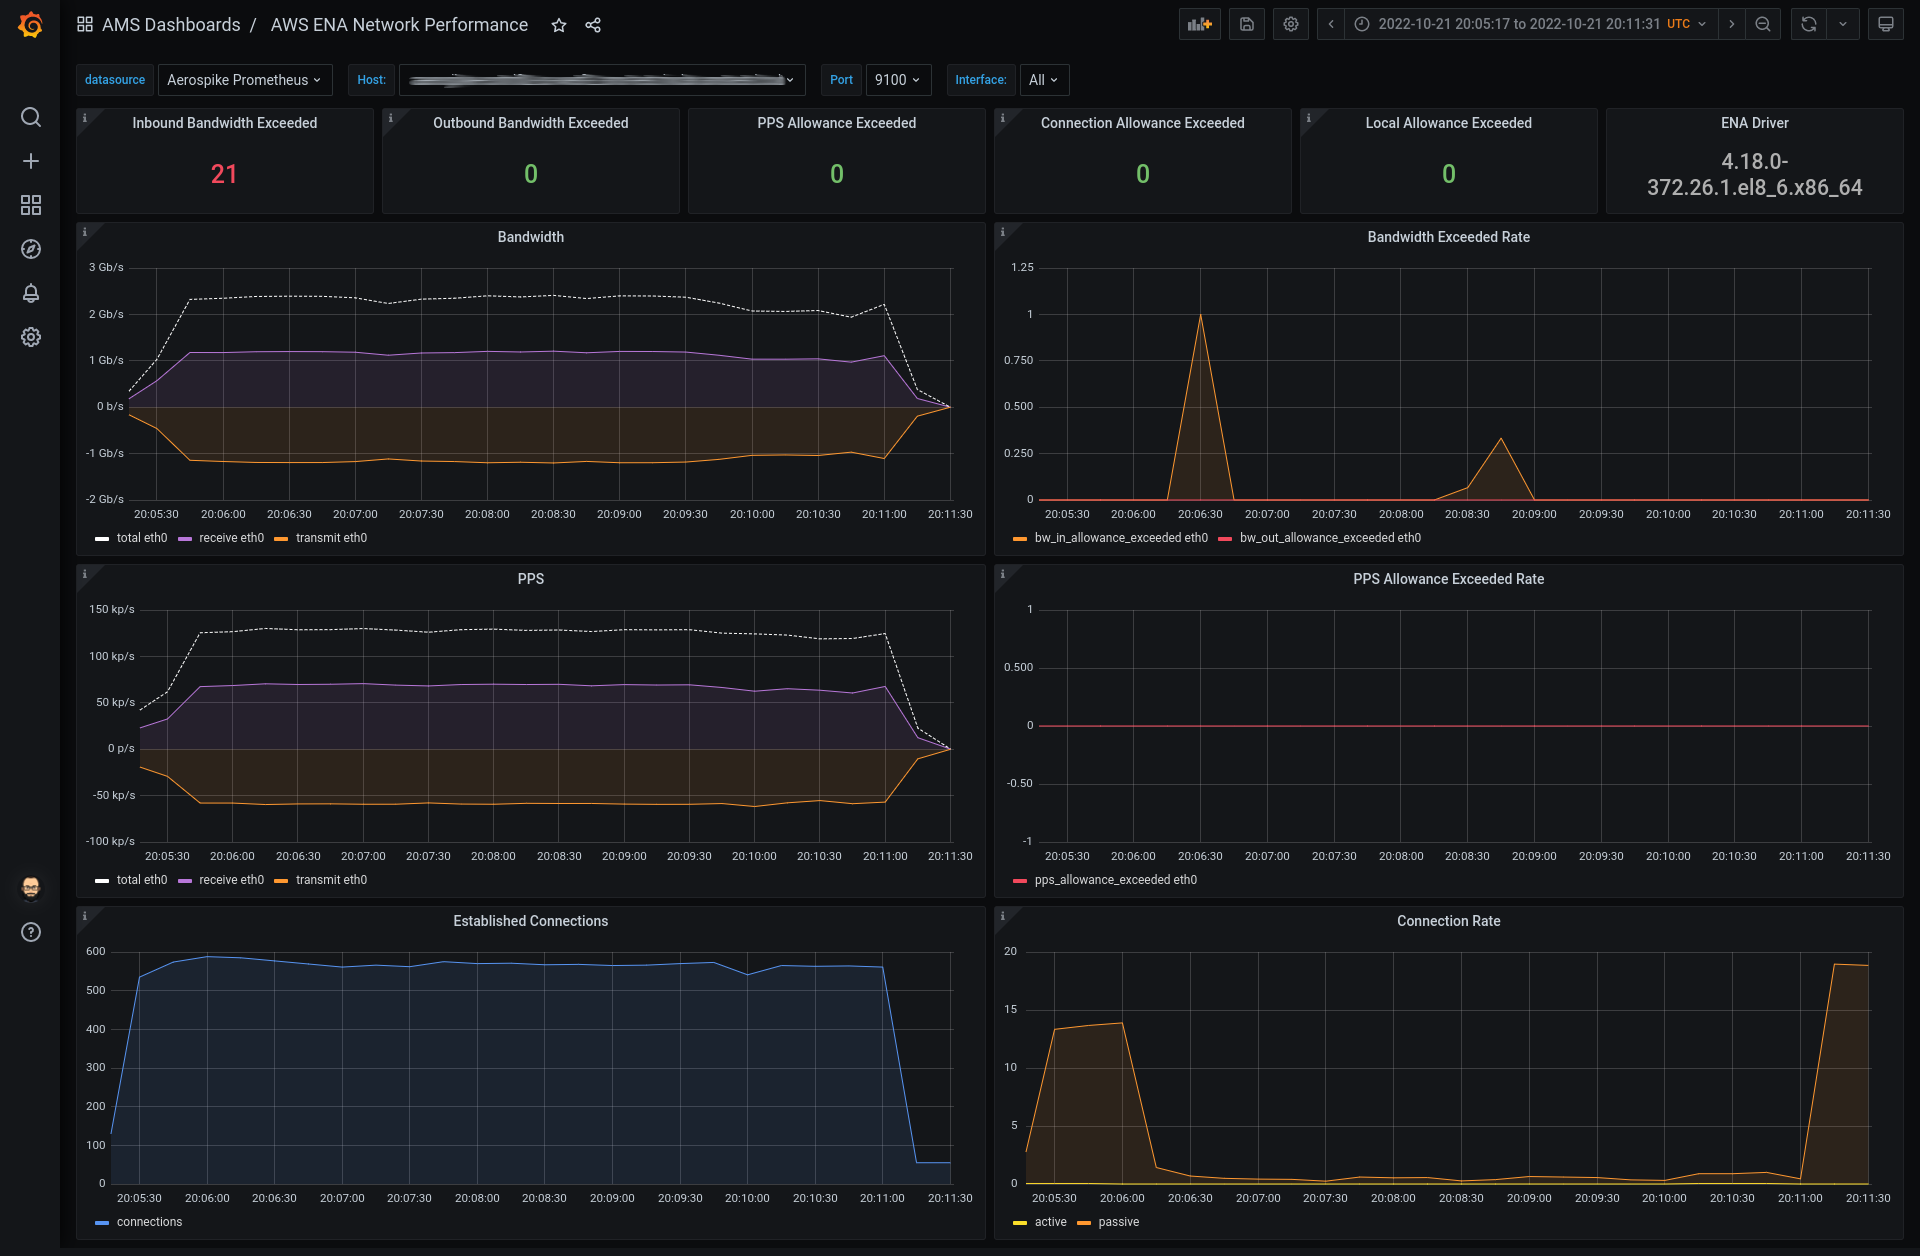
Monitoring AWS ENA metrics using metrics provided by Prometheus Node Exporter. For details on the ENA metrics see the AWS documentation: Monitor network performance for your EC2 instance.
Exporting the ENA metrics requires enabling the ethtool collector which is not enabled by default. Enable using the --collector.ethtool command-line argument to node_exporter. Also makes use of the netstat collector which is already enabled by default.
Data source config
Collector type:
Collector plugins:
Collector config:
Revisions
Upload an updated version of an exported dashboard.json file from Grafana
| Revision | Description | Created | |
|---|---|---|---|
| Download |
AWS
Easily visualize and alert on more than 60 Amazon Web Services (AWS) resources using the fully managed Grafana Cloud platform.
Learn more