Telegraf / Raspberry Metrics InfluxDB 2.0 (Flux)
Dashboard for displaying basic raspberry (or other Linux) metrics. With telegraf and InfluxDB 2.x (FLUX)
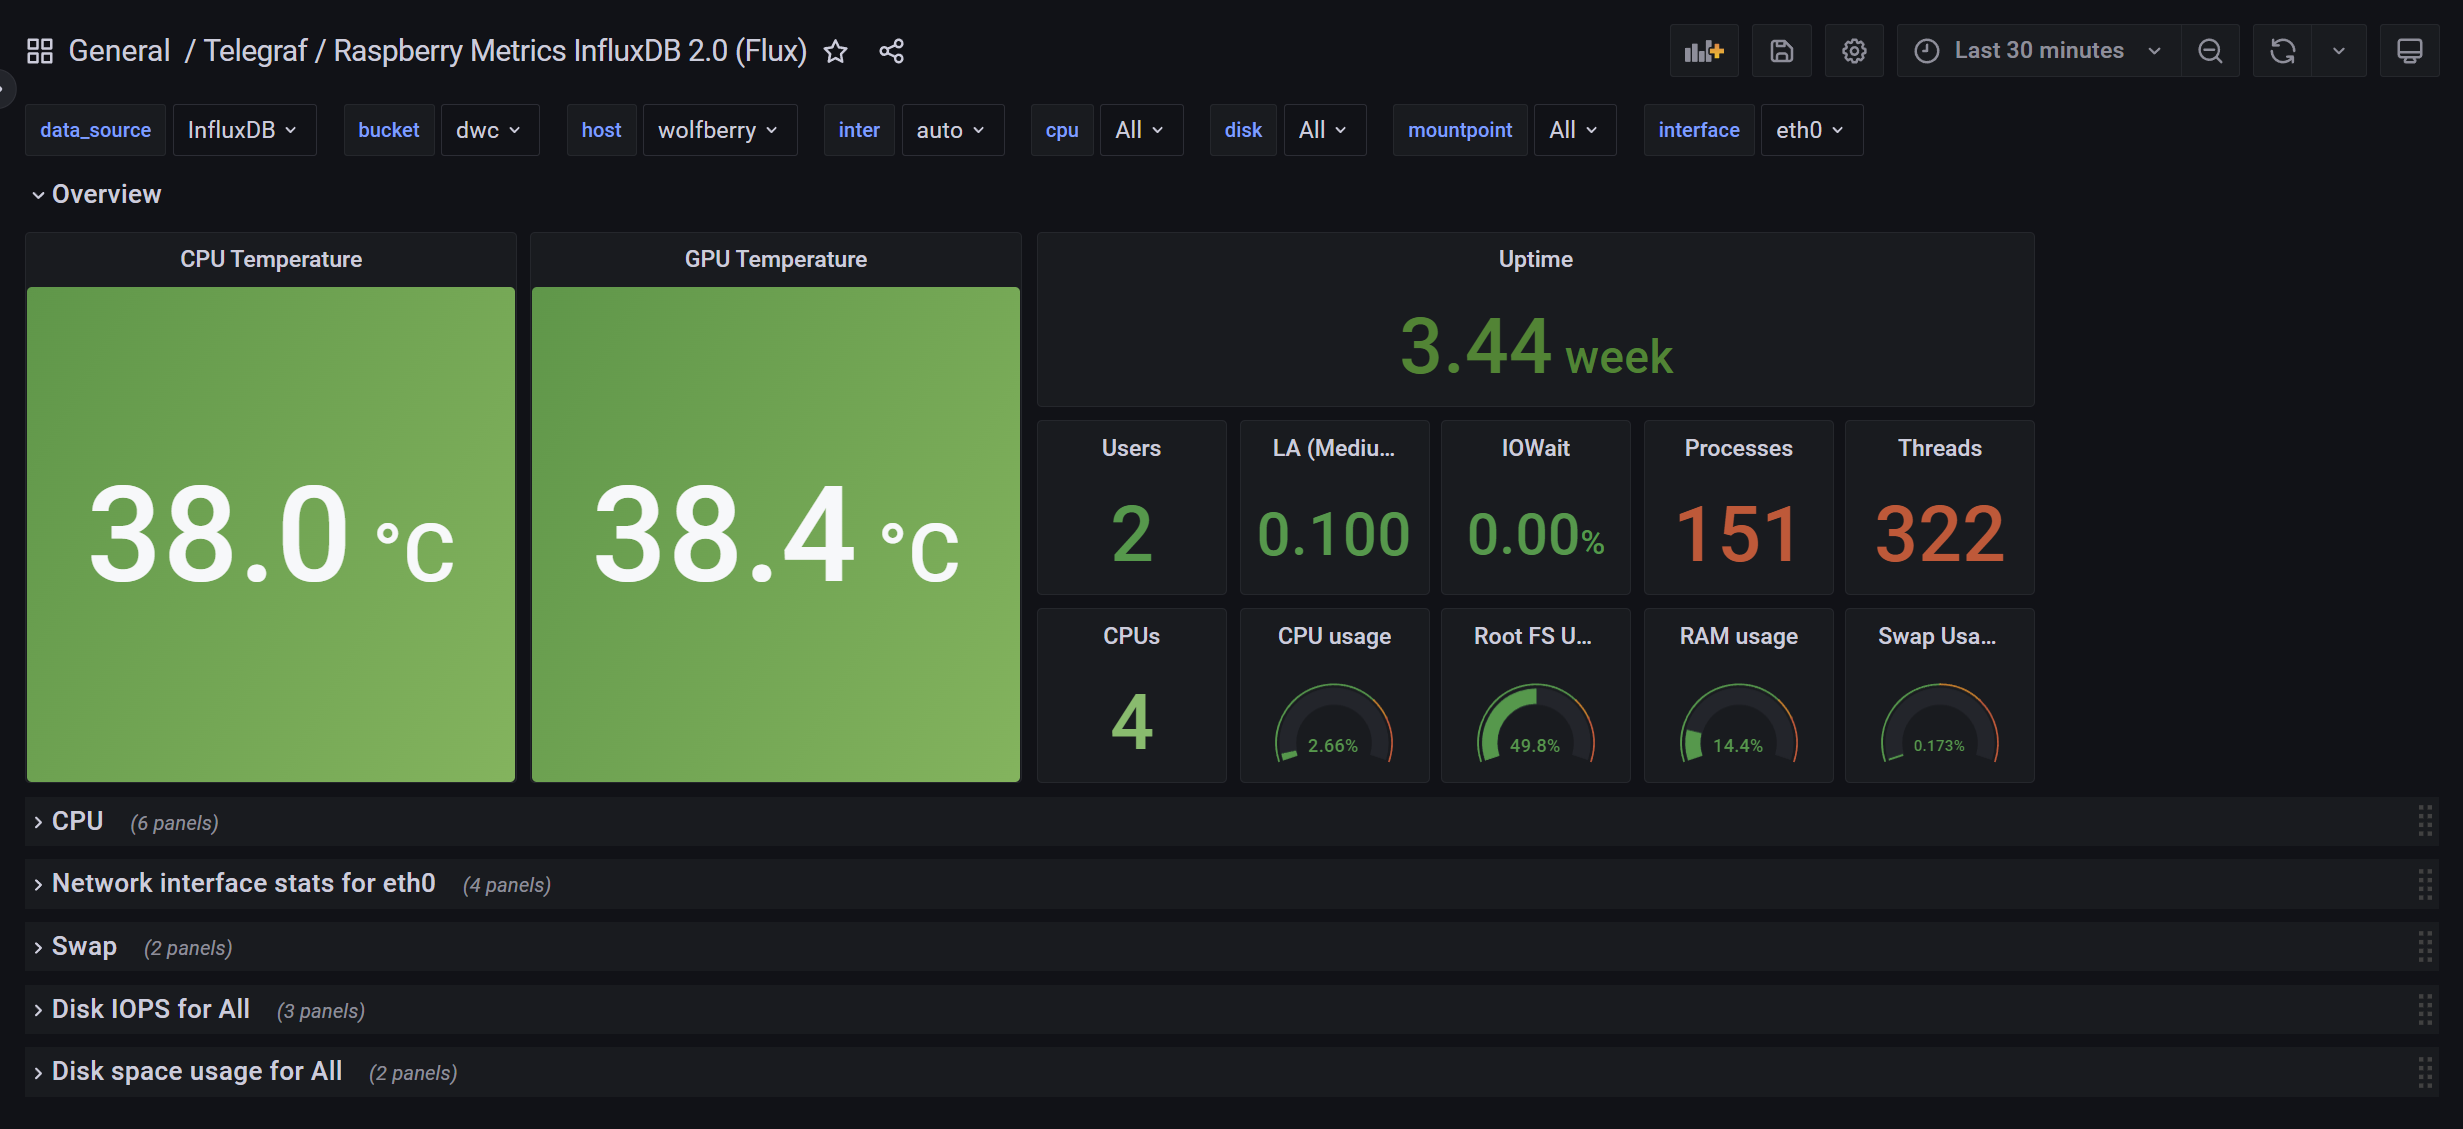
Raspberry basic metrics for InfluxDB 2.x (FLUX)
to collect some core-data the telegraf-user need access in the video group:
sudo usermod -G video telegraf
Temperature
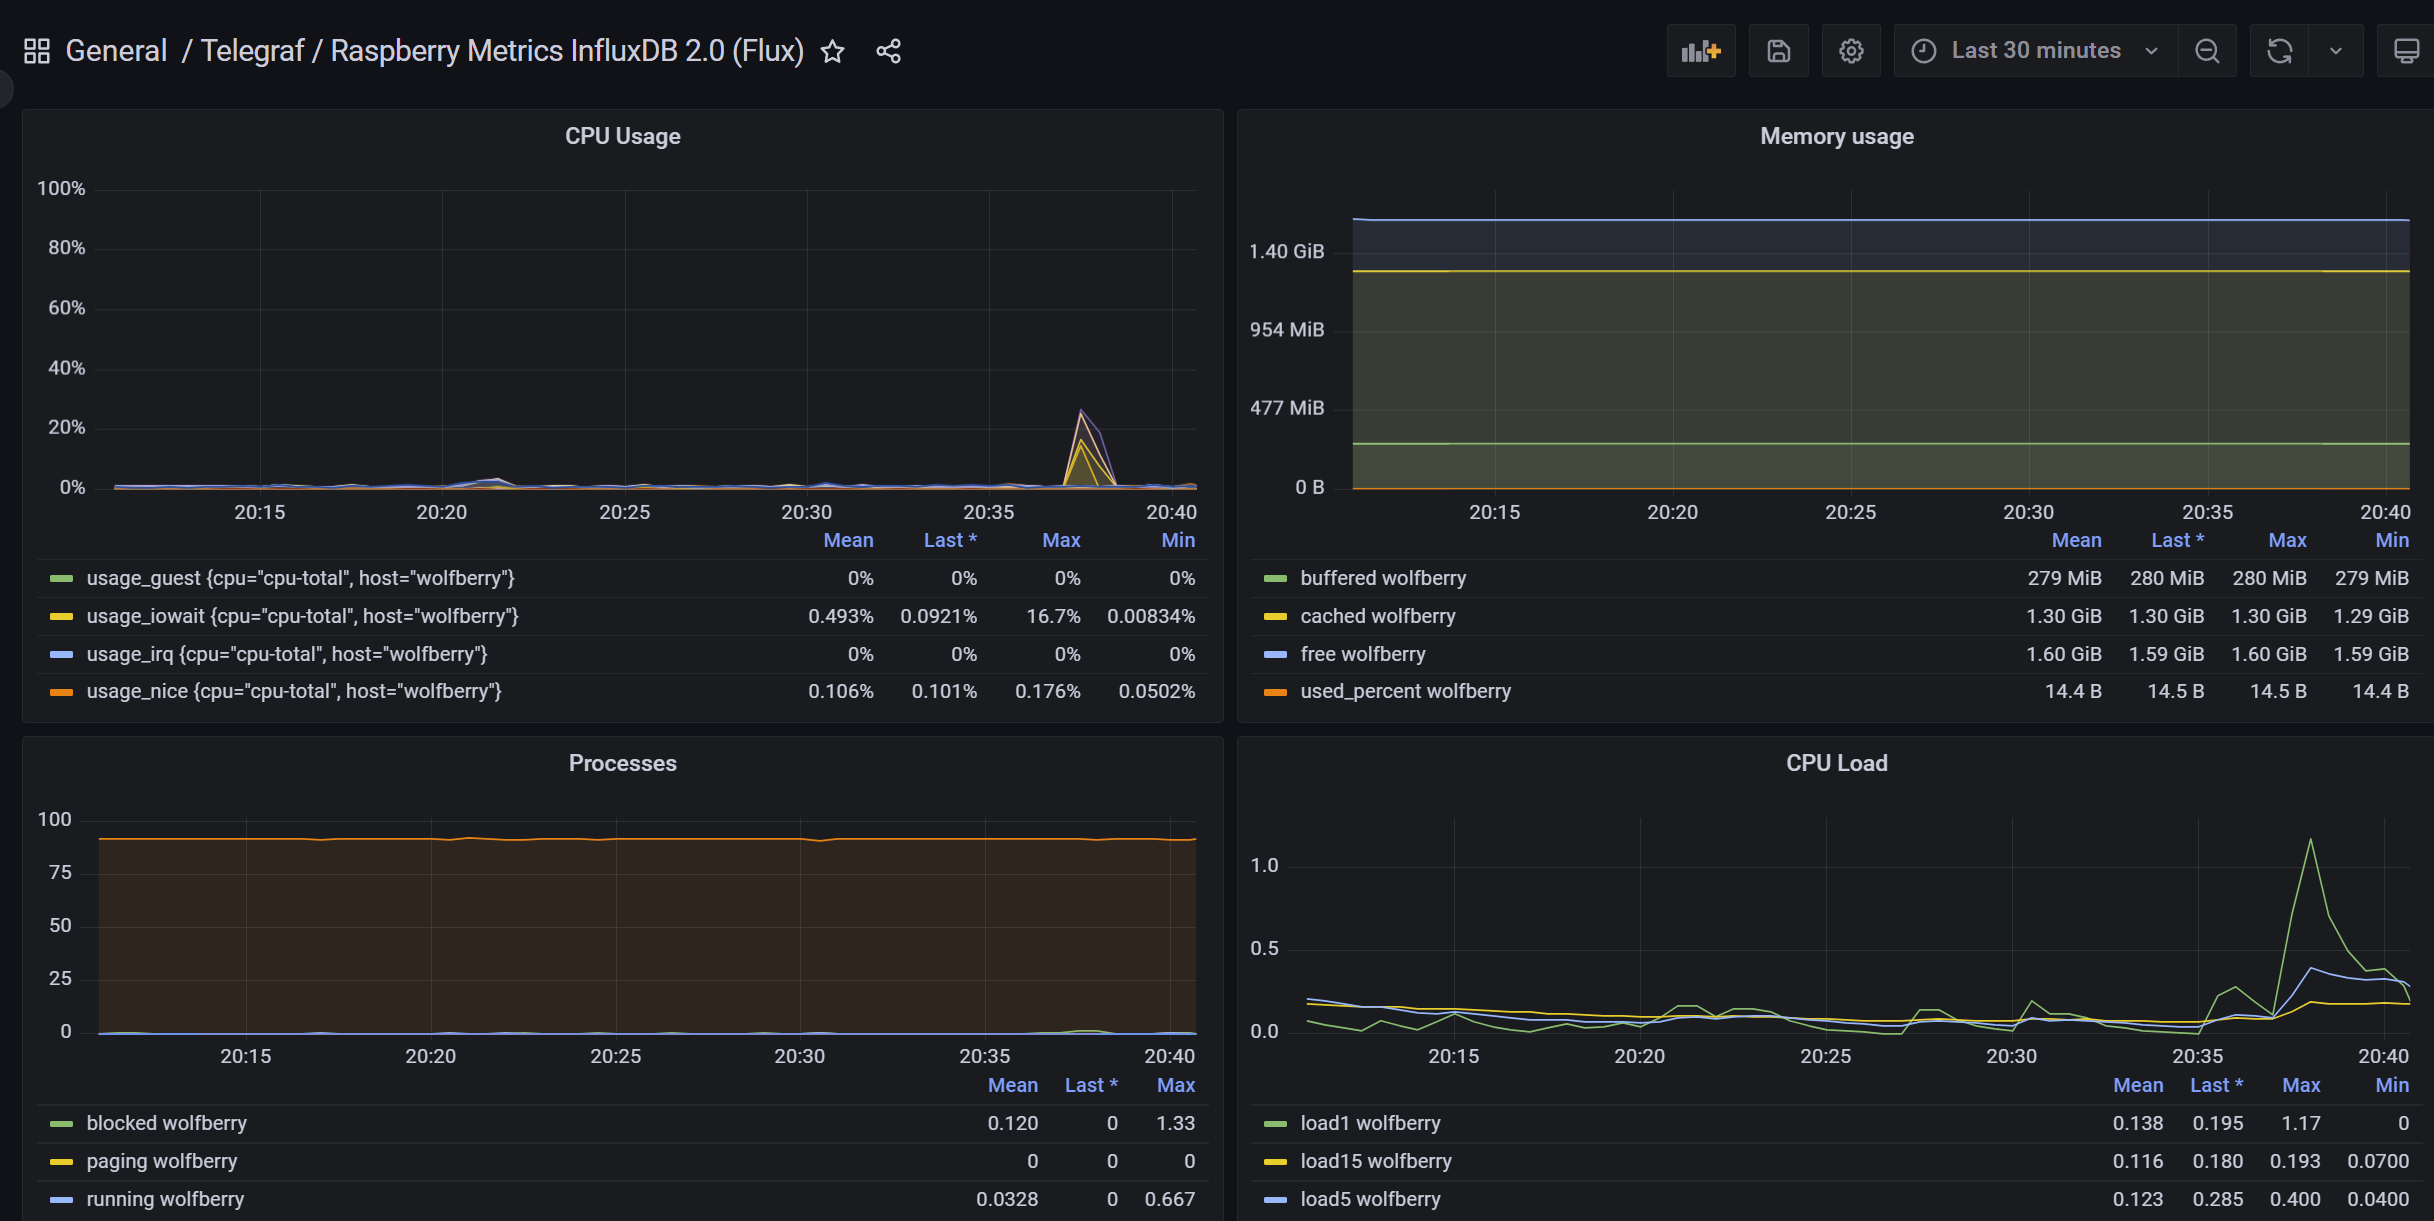
CPU usage
RAM usage
Disk usage
SWAP usage
Network usage
after some inquiries here is the link to a tutorial how to install influxdb 2.0 / grafana on a raspberry (german only): https://darkwolfcave.de/raspberry-pi-influxdb-2-telegraf-grafana-anzeigen/
Data source config
Collector type:
Collector plugins:
Collector config:
Revisions
Upload an updated version of an exported dashboard.json file from Grafana
| Revision | Description | Created | |
|---|---|---|---|
| Download |
InfluxDB
Easily monitor InfluxDB, an open source time series database, with Grafana Cloud's out-of-the-box monitoring solution.
Learn more